How to Build and Optimize FinOps Data Workflows
Summary: FinOps practitioners rely on trusted, consistent data to drive cloud cost visibility, accountability, and informed decision-making. Learn how to design and implement FinOps data workflows that integrate cloud billing data, business context, and operational metrics into a curated dataset. By establishing reliable ingestion, normalization, and automation processes, organizations can create a single source of truth for FinOps reporting and analysis. Engage different personas, from engineering to finance and executives, and build workflows to support forecasting, budgeting, optimization, and strategic planning.
In early stages of a FinOps practice, it can be challenging to curate vast amounts of complex data. Trusted, consistent, and transparent cost and usage data is core to building a successful practice within your organization, and it’s important to build strong data workflow fundamentals.
Use this paper to learn key principles and sample workflows that enable FinOps practitioners to:
- Define FinOps reporting requirements
- Build a practical FinOps data model to integrate data sources
- Introduce automation for manual allocations
- Integrate data from various sources and drive maturity from tactical (i.e. excel) to strategic (structured, well managed) data sources
- Generate a single data lake for all downstream reporting
- Provide a flexible structure to accommodate all of your data sources.
The data in your organization could be in an excel spreadsheet that someone has been collecting over time. It could be coming from your cloud service provider, or it could be found in a third-party tool the organization has for cost allocations. Regardless of the state of data, it’s imperative that accurate data is the foundation for everything a FinOps practitioner does.
Who should read this paper
This paper benefits practitioners at organizations of any size or complexity who are very early or even in a pre-adoption phase of their FinOps practice. This paper benefits all industries, clouds, or services. It identifies guidance and best practices useful for any Capability or Persona as it involves the lead up to the establishment of a FinOps practice.
Prerequisites
To understand and effectively utilize this paper, foundational FinOps and cloud computing knowledge is required. An understanding of data lake architecture, data ingestion, data governance, data storage, and data processing techniques would contribute to comprehending and applying the concepts presented in this document. The following are some resources to help familiarize yourself with these concepts:
- https://www.finops.org/wg/cloud-cost-allocation/
- https://en.wikipedia.org/wiki/Data_lake
- https://www.upsolver.com/glossary/data-lake
Implementing a FinOps data workflow
This paper contains five sections that FinOps practitioners should consider when starting to think about implementing a FinOps data workflow. These sections will provide structure and best practices for implementing a data workflow.
- Importance of Data Accessibility: Why accurate and reliable data is paramount to FinOps success
- Personas: Why the data workflow is important to the various FinOps personas
- Data Sources: What types of data sources should be considered for this type of workflow
- Outputs: What are the downstream benefits that result from this workflow being in place
- Architecture Diagrams: What are some sample architecture diagrams that will fit your organization
Importance of data accessibility, visibility, & understanding
A core principle of FinOps is that data needs to be accessible and timely. Let’s first examine possible ways that people obtain data and the state of the data from those sources.
Scenario 1 – Build
The first scenario includes obtaining cost data from their cloud provider’s tools and an organization’s metadata. Native cost tools can provide a high level view of costs, but often are not meant for in-depth slicing and dicing of data needed by a FinOps practitioner. Most cloud service providers (CSPs) have other methods of getting access to more detail, but this often amounts to very large files that contain a vast amount of data that can easily be misinterpreted. This data needs to be cleaned and normalized.
Pro-Tip: It is important for data coming into a workflow to be cleaned and normalized so that data is readily available for later stages of the workflow.
Scenario 2 – Buy
The second scenario includes obtaining data from a third-party cloud management tool. These tools are user-friendly ways of viewing your data without the complexity of CSP’s detailed data availability. Most tools provide a single pane of glass for cost data by incorporating data from multiple cloud service providers.
Third-party tools are able to normalize data in a more meaningful way. A classic example is asking how many variations of a cost center tag do you have (ie-CostCenter, costcenter, Cost Center, CostCentre, Cost_Center). The third-party tool will ensure that there is a singular data dimension that normalizes the data, creating cleaner and more practical reporting.
Despite all the benefits of a third-party tool, what can happen is business units could still see different figures between their P&L and the third-party tool. Possible reasons for this difference could be:
- Untagged or untaggable resources
- Shared services or shared infrastructure
- Calculations done offline or in spreadsheets
- A single person who knows from their years of experience that project X hits cost center Y even though it’s not tagged in your reports
While the scenarios presented above are examples, it is clear that there is a need to have accessible and consistent data that everyone can rely on. Clean, reliable data should not be constrained by limited employee knowledge or who has access to which offline process or spreadsheet. The FinOps team strives to enable transparent, reliable, and accessible data to support informed decision-making, consistent cost visibility, and accountability for stakeholders to drive the intended business value of using the cloud.
This workflow is intended to provide the framework to align cost data into a cohesive, curated data set that provides the foundation for all FinOps reporting. Delivering a curated data set that feeds this reporting enables data consistency, promotes a common language, the ability to automate manual processes, drives timely reporting, and improves traceability (auditability) of the data.
Personas & Motivations
As cross functional teams come together within an organization’s FinOps practice, or as part of a Cloud Center of Excellence (CCoE), it becomes apparent that there are different areas of focus and priorities based on an individual’s background or role. Likewise, the data needed for these team members will be different. When developing a data workflow, it is important to understand who will consume and how they will use this data. Therefore, it is important to consider the interests and motivations for each of the FinOps personas.
FinOps Practitioner
FinOps practitioners are a vital link between business, IT, and Finance teams, assuming a crucial role in data workflows. To effectively create meaningful reports, a FinOps practitioner must comprehensively understand the requirements of both IT and Finance teams. Without this understanding, there is a risk of wasting time and effort on futile tasks. Creating a data workflow enables the FinOps practitioner to ensure that accurate and reliable reporting is delivered to the entire organization in a way that represents a single source of truth.
Budgeting and data lake handoff
The FinOps practitioner encompasses the crucial tasks of budgeting, creating, and facilitating the handoff of the data lake environment to the operations team for ongoing maintenance. Collaboration with IT and Finance teams is needed to ensure the data lake infrastructure is correctly scoped and funded within budgetary constraints to provide a scalable data lake environment.
Pipeline management and monitoring
The FinOps practitioner oversees the implementation of pipelines to facilitate data ingestion from external sources into the data lake. While they may not always be directly involved in the implementation process, they are responsible for monitoring and following up on the pipeline implementation to ensure it functions correctly and meets the intended objectives. This involves regularly verifying the data ingestion process, validating data quality, and addressing any issues or discrepancies that may arise during the pipeline operation.
Guidance and support for data access
In addition, the FinOps practitioner provides essential guidance, documentation, and best practices for accessing the data lake to different personas within the company. Recognizing that individuals from various roles and departments possess varying knowledge and insight, the practitioner assists these different personas in accessing the data lake effectively to accomplish their specific objectives. This may involve creating user-friendly documentation, organizing training sessions, and offering ongoing support to ensure users can confidently navigate and leverage the data lake for their individual needs. By providing this guidance and support, the practitioner empowers users across the organization to make informed decisions based on the available data and optimize their workflows accordingly.
Engineering and Operations
Engineering and Operations people are primarily concerned with the overall performance and efficiency of the resources and solutions of their organizations. The engineering and operations teams include Lead Software Engineers, Principal Systems Engineers, Cloud Architects, Service Delivery Managers, Engineering Managers, or Directors of Platform Engineering.
Adherence to cost allocation strategies
They are responsible for verifying that the cost of all tools used within engineering are accounted for. This includes confirming proper resource tagging across various services, which helps organize and manage the resources effectively and to match cross-vendor costs.
Cost and performance metrics
They will be interested in usage, performance, and cost related data.
Finance
Finance team members are typically interested in data that can be used for accounting purposes, financial reporting, or forecasting. Examples of finance team members can include Financial Planners, Financial Analysts, Financial Business Managers/Advisors, and Accountants. To accurately manage and forecast cash flows, finance teams need visibility into the potential upfront payments related to cloud subscriptions and discount programs.
Historical analysis and cloud impact
Finance teams need the ability to analyze historical cost trends when preparing forecasts and budgets. Even if other cost evaluation tools and processes are in place, there is always a need to compare projected spend to historical run rate. Finance teams also need to understand how cloud usage impacts the P&L each month after all allocations, discounts and chargebacks are considered. They need access to a view that ties to the invoices sent by cloud service providers.
Data formatting and mapping
It is best practice to involve the Finance team in the resource mapping effort to make sure costs are properly accounted for in the P&L and other financial statements.
Hierarchical data management
From an expense planning/budgeting perspective it is crucial to map resources to their respective cost centers to make sure the Finance team can track and report costs at the appropriate level. The ideal data model will include various hierarchical levels from account to business unit. Finance teams maintain real-time access to the account hierarchy and can suggest changes when organizational updates require it.
Business/Product Owner
Business/Product Owners are typically responsible for a specific service, application, or product line and are primarily concerned with understanding the cost of running said product or service. Examples of Business/Product owners include Service Owners, Product Owner, Application Owners, Director of Cloud Optimization, Cloud Analyst, or Business Operations Manager. They aim to offer feedback on reporting requirements, ensuring the necessary information and metrics are included in the reports.
Meeting strategic Objectives and KPIs
As Business/Product owners work towards the targets and benchmarks for their respective areas, they will need access to various key performance indicators, from cost metrics (monthly cost per application or service, cost per customer, cost per deployment, etc.) to performance metrics (uptime, requests per minute, CPU utilization, etc.).
Forecasting Costs and Profitability
Product owners are also interested in forecasting costs in order to understand the profitability of additional feature requests or product enhancements. A data workflow model will enable this type of analysis by using all the available data provided, incorporating relevant information to generate accurate projections.
Cost Verification and Anomaly Detection
They are responsible for verifying that costs align with forecasts. If any anomalies are detected, they allocate time for further investigation to understand the reasons behind the discrepancies.
Executives
Executives are responsible for driving the direction of their respective organizations. In terms of FinOps data, that includes driving accountability, transparency, and supporting the FinOps cultural shift. Examples of executives include the VP/Head of Infrastructure, Head of Cloud Center of Excellence, Chief Technology Officer (CTO), Chief Financial Officer (CFO), or Chief Information Officer (CIO).
Cultivating data-driven culture
Executives must also foster a culture of data-driven decision-making within the organization. This involves encouraging teams to support their proposals and recommendations with relevant data and analysis.
KPIs and benchmarks
Executives typically are interested in high-level Key Performance Indicators (KPIs) and each team’s targets that reflect the organization’s goals. Examples of these high-level metrics might include revenue data, margin data, cost as percentage of revenue, or cloud expense as percentage of revenue. These KPIs act as measurable metrics that align with the organization’s strategic objectives.
Setting specific targets or benchmarks for each KPI helps assess the performance and progress of individual teams. Regular reporting mechanisms should be implemented to track and monitor these KPIs, ensuring progress is measured and reported to the relevant stakeholders, including the executive and finance teams.
Procurement
Procurement team members are primarily focused on the relationship with and contractual nuances of vendors and CSPs. Examples of procurement members include Procurement Analysts, Sourcing analysts, Vendor Management Associates.
Negotiation preparation
Procurement teams need read-only access to all information related to the usage for the specific vendor they are negotiating with. One of the primary objectives of a procurement team member is to get the best deal possible for the organization. That can range from maximizing the potential discount to getting additional services for projected future usage.
Historical analysis
In order to be successful in their negotiations with cloud service providers, procurement teams need to view historical usage before any discount is applied because commitments are usually based on pre-discount usage. They may also need to collaborate with Finance teams on forecasts for multi year spend commitments.
Cloud resource utilization
Utilization rates are also key for procurement as this will serve as a basis for discussion with cloud service providers.
Data sources
This section discusses the common data sources that should be considered for any FinOps data workflow. Each data source examined below includes a description of that data, how that data is used, examples of that data source, and some best practices to consider around timing.
While these are common data sources, it’s important to understand the reporting needs of your organization. Some organizations may not use all of these data sources while other organizations may have additional data sources to incorporate into their workflow.
As organizations develop a data workflow it is important to maintain the quality and integrity of the data. Traceability and auditability of the data should be taken under consideration during the development of the workflow as well as having ongoing periodic audits.
Cloud spend and pricing
This serves as the primary source of accurate data for achieving a consistent dataset. However, acquiring this dataset involves ingesting data from various cloud providers using multiple mechanisms, such as retrieving CUR files from AWS S3 buckets for object storage or utilizing APIs for Azure, among others.
It is crucial to acknowledge that different cloud providers offer diverse billing programs, resulting in varying methods of accessing billing data. For instance, in Azure, the endpoints and API schemas for billing data APIs differ depending on the program, whether it’s PayG, Azure EA, or Azure CSP. It is important to have reliable data workflows to address these diverse feeds of data.
| Category Name | Public Cloud Billing |
| Description | This is the core dataset from a FinOps perspective. It contains the detailed, granular consumption and billing information that can be used to form a picture of consumption and cost for most cloud services. It can also be enriched with tagging metadata to enable mapping to other key datasets within your organization. At a minimum, public cloud billing data will include:
Note that currently, public cloud billing data is not consistent across cloud providers. The FinOps Open Cost and Usage Specification (FOCUS) project is working to establish a common billing data format. |
| How it is used | As the core dataset, cloud billing will have multiple use cases. Common examples are:
|
| Examples |
|
| Timing | Update Frequency: Updates to cloud billing datasets vary in frequency between cloud provider and cloud services, however a daily update can generally be relied upon for usage data.
Pro-Tip: For monthly billing datasets to match the invoice amount, be aware that finalization of the datasets are subject to delays. Key Dates:
|
| Category Name | Public Cloud Tagging |
| Description | Tagging is metadata which provides additional granularity to billing reporting that can enable mapping to other key datasets within your organization. Maintaining clean tagging data is critically important for accurate and reliable reporting. Tagging policies and third party tools can help with maintaining and normalizing tag data; especially for multi-cloud organizations. The tags and associated values applied to a cloud resource, accounts, resource groups, etc. can feed into the Public Cloud Billing data. However, not all tags on cloud resources appear in the cloud billing data, gathering the full set of tags associated with cloud resources can add further context/details to the use/value of the resource. |
| How it is used | Common examples are:
|
| Examples | Common Tags may include:
|
| Timing | Metadata should be ingested with billing data. |
| Category Name | Public Cloud Pricing |
| Description | The price sheet contains the details about a cloud provider’s rates for its services. Rate information contained within these files include both on-demand rates as well as rates for commitment-based discounts. |
| How it is used |
|
| Examples |
|
| Timing | Update Frequency
|
| Category Name | Configuration Management Database |
| Description | Configuration Management Databases (CMDBs) are used to store IT configuration records and the relationships between them. They are generally populated via a combination of automated and manual processes and are intended to be used as the ‘source of truth’ for IT configuration information within an organization. The reality is that CMDBs are only as good as the data feeds and processes used to manage them, so before incorporating CMDB datasets into a FinOps data model, the quality, accuracy and timeliness of the data must be assessed.
The primary use-case of CMDB data in a FinOps dataset is Application and Service data. A well managed CMDB will be the source of truth for data such as Application and Service names, ownership, organizational alignment, criticality and hours of operation. This data can provide the crucial link between cloud consumption, applications and people. CMDBs can also maintain records of public cloud configuration via automated and regular data feeds, however the source of truth for this type of data is always going to be the cloud platform itself so this is not being considered as a source of data for a Finops dataset. |
| How it is used | Mapping cloud spend and configuration data to:
|
| Examples | CMDBs are generally part of a broader Service Management tool and each will have their own unique data model. Common examples include:
|
| Timing | Update Frequency: CMDB datasets are updated frequently as a result of change activities or automated discovery. A monthly update to CMDB data will be sufficient for most use cases, however a daily update may be required for some use cases e.g. anomaly detection or cost alerting. |
Pro-Tip: CMDB Application and Service data can be used to populate resource tags on a cloud platform, which is in turn incorporated into the dataset by way of the cloud billing data, eliminating the need for a direct feed from the CMDB. This approach may be also implemented for non-FinOps use-cases such as enabling self-describing cloud resources to support operations and automation activities.
There are pros and cons to either approach:
| Data Source | Pros | Cons |
| CMDB |
|
|
| Resource tags populated from CMDB |
|
|
| Category Name | Finance Cost Centers |
| Description | A cost center represents the smallest segment of an organization for which you collect and report costs (project, team, department, etc.).
Only a small number of segments within an organization are revenue or profit centers. Some are cost and profit centers at the same time. The organization determines whether to set different codes for cost and profit centers. |
| How it is used | The finance function is responsible for creating, updating and maintaining a cost center’s record within the financial accounting system. Cost center creation and on-going maintenance requests are sent to the financial reporting systems team who follow a set of defined steps to ensure the request is valid, permitted and properly authorized.
For a cost center to meet its collect and report objective it also needs a general ledger (GL) account number. The GL account number makes up the second part of the composite number needed to properly collect and report costs. The cost data collected and reported are the base information reported in financial statements such as: Profit & Loss Statement, and Balance Sheet. The cost information collected is also used to allocate cost to other cost centers e.g. from Human Resources to profit centers. Cost center groups or pools support generating reports across multiple cost centers for management reporting and decision-making at a higher level.. |
| Examples |
|
| Timing | Financial Cost Centers should be updated with Cloud billing data at least, or more frequently on business requirements. |
| Category Name | Organization structure data |
| Description | In traditional organizational structures, the Org Chart (or Org Tree) is a visual representation of the organization where employees are grouped by function, region or product line.
The staff list provides information on span of control, chain of command and general information at employee-level (contact information, timezone, geography). The staff list is a living and breathing document, unlike the org tree which may not get updated in real time. |
| How it is used | Org tree is used to complement other data sources (Cost centers and CMDB data). In FinOps, org trees and staff lists are useful resources to understand ownership of the different business lines/region/products in order to design and grant access to the necessary reports and metrics.
Integrating business context, organization structure, and metadata into the billing data workflow ensures that end users can access and analyze information in a manner that makes sense to the business. They can view costs and usage patterns based on the organization’s structure, understand the financial impact of projects or clients, and accurately allocate expenses. By incorporating this context, businesses gain valuable insights and make informed decisions aligned with their specific objectives. |
| Examples | Org trees or staff lists are typically under the purview of HR or IT departments, with accessibility through APIs or data storage systems. These applications may either be self-hosted or offered as a service (SAAS). |
| Timing | Org Charts are typically updated when organizational changes take place.
Staff lists are usually updated more frequently as employees join and leave the organization. |
| Category Name | Budgets (Cloud Spend) |
| Description | Cloud spend budget should be prepared prior to the start of the business cycle, with a supplemental budget or budget revision prepared as needed based on changing business conditions.
Of the many common budgeting methods, the two most efficient to build and maintain are incremental and activity-based budgets. Cloud spend aligns better to activity-based budgets, albeit the activities can move very fast and grow into a large number of activities within a very short amount of time resulting in significant and unexpected cloud expenses if not actively managed. |
| How it is used | Budgeting for cloud spend should be initiated and maintained by the cloud infrastructure delivery team with continuous input and feedback from key stakeholders i.e. engineering, product, leadership, finance and procurement.
Elements of the cloud budget help to properly develop a spend plan that ensures the organization’s objectives are met and valuable financial resources are not wasted. The elements are:
|
| Examples | Type of budgeting method: activity-based budget
Draft of template to capture cloud budget details: Cloud Spend Budget Workup-draft |
| Timing | Budgets are typically prepared ahead of the new fiscal year and revised monthly, quarterly, or semi-annually to reflect business changes. Adjustments made when budgets are refreshed needs to be captured. |
| Category Name | Performance and Utilization Data |
| Description | Organizations can gain valuable insights and achieve cost savings by establishing data workflows to capture utilization data across various metrics and cloud resources. This data is vital for understanding resource utilization, optimizing resource allocation, and improving cost efficiency.
Data workflows should cover a wide range of cloud resources, including virtual machines, storage volumes, databases, and containers. By capturing metrics like CPU utilization, memory usage, and network traffic, businesses can analyze utilization trends, identify inefficiencies, and make informed decisions. These decisions may include right-sizing instances, eliminating underutilized resources, and leveraging cost-saving opportunities such as reserved instances or committed use discounts offered by the cloud provider. In summary, establishing data workflows to capture utilization data across different metrics and cloud resources is crucial for organizations to gain insights, optimize resource allocation, and achieve cost savings. By making informed decisions based on this data, businesses can maximize their cost efficiency in the cloud environment. |
| How it is used | Performance and utilization data is utilized in FinOps to gain insights into resource efficiency, identify underutilized assets, and optimize cost allocation by aligning expenses with actual usage patterns. |
| Examples | Some Cloud provider examples:
|
| Timing | These metrics should be collected frequently, preferably every minute or every 5 minutes. |
Outputs
Equally important as understanding the data sources is understanding the outputs of this workflow. As discussed in previous sections, there are several personas across an organization; all of whom have their own interests and responsibilities.
When we talk about developing a workflow for integrating data sources, automating manual processes, and generating a single data lake, it’s all for naught if the workflow doesn’t produce clean, reliable data for the personas consuming this data. In terms of a data workflow, if personas are the who, data integration and modeling are the what, then the outputs are the why.
This section covers some of the common categories of outputs that this data workflow will enable. Details include a description of what type of outputs can be delivered, primary advantages/achievements gained from implementing this workflow, automation opportunities, primary personas impacted, and which data sources contribute toward this output. This isn’t to say that only those personas can benefit or that there aren’t other advantages gained, but what is outlined are the primary or direct benefits from this workflow.
While we list some KPIs here as an example, there is a separate working group focused on KPIs. You can learn more by visiting the link at the end of this paper.
| Output Name | Financial Reporting |
| Description | Curated data set that represents a single source of truth that already contains allocations, mappings, and everything that a finance team will need to produce monthly, quarterly, or annual financial reporting. |
| Advantages |
|
| Primary Consumers (Persona) |
|
| Data Sources Included |
|
| KPI/Unit Economic Examples |
|
| Automation Opportunities |
|
| Output Name | FinOps Practitioners Reporting |
| Description | FinOps practitioners would be able to query from curated data ensuring consistency in all downstream reporting. |
| Advantages |
|
| Primary Consumers (Persona) |
|
| Data Sources Included |
|
| KPI/Unit Economic Examples |
|
| Automation Opportunities |
|
| Output Name | Business/Product Owner Reporting |
| Description | Business/Product Owners get their cost and usage data in a timely and accurate fashion. The cost data already includes ties back to their P&Ls so there are no surprises nor out of sync data. |
| Advantages |
|
| Primary Consumers (Persona) |
|
| Data Sources Included |
|
| KPI/Unit Economic Examples |
|
| Automation Opportunities |
|
| Output Name | Executive Reporting |
| Description | Executive level summaries that aggregate up the consistent and reliable data that is also consumed by finance and business teams. |
| Advantages |
|
| Primary Consumers (Persona) |
|
| Data Sources Included |
|
| KPI/Unit Economic Examples |
|
| Automation Opportunities |
|
Architecture Diagrams
In the previous sections you learned about various data sources, personas involved, and potential outputs delivered by implementing a data workflow for cloud cost data. This final section of the paper is designed to provide an example to help guide organizations as they start to consider what their workflows could look like. Contained within this section are architecture diagrams, brief description of what the diagram entails, and tables detailing what is occuring at each step in the workflow.
In Figure A, we present a typical flow using the data sources outlined in the previous section:
Figure A
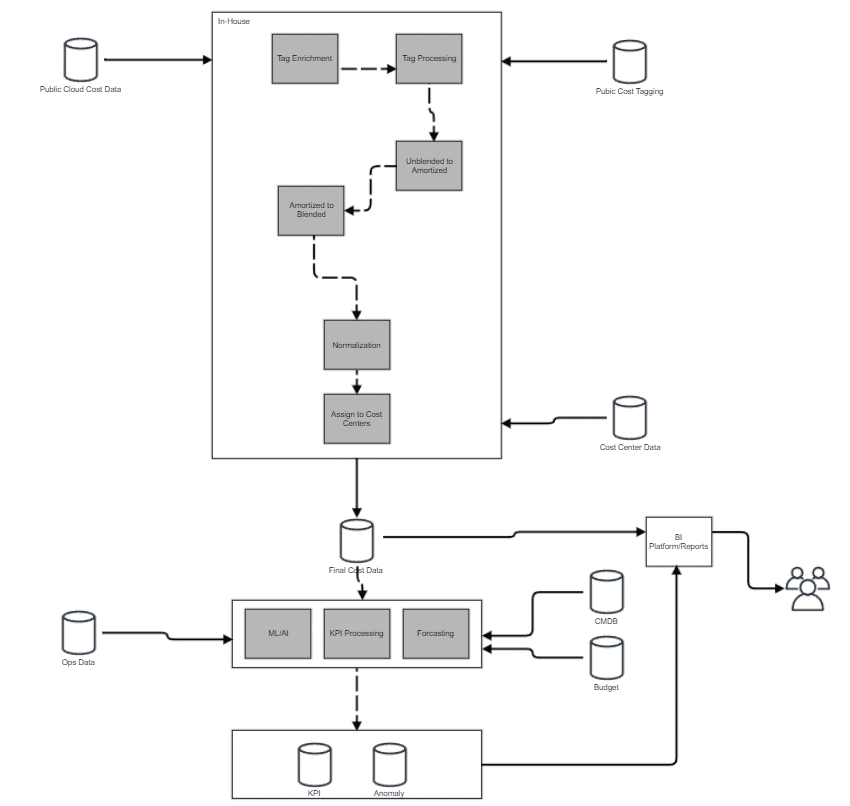
You can see in figure A that process starts with receiving ‘Public Cloud Cost Data’ from cloud providers, this data is then processed at different stages* that add tags or amortize cost or assign cost to ‘cost centers’. Resulting ‘final cost data’ can be shared with various stakeholders e.g., BI tools to share showback/chargeback information.
Figure A also depicts that additional integration with additional dataset like operational data, CMDB and budgets and processing, final cost data can also be used to generate additional KPI, forecast budget or Anomaly detection.
* NOTE: Details about different processing stages are provided below.
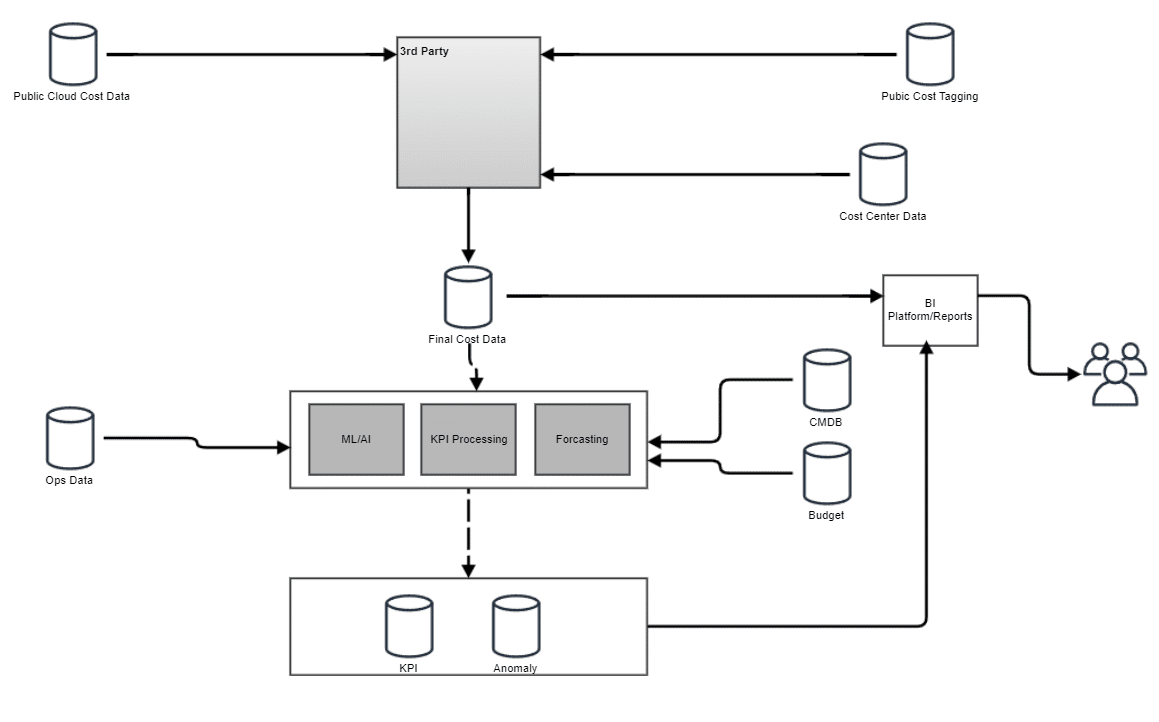
Many third-party solutions are available that support some or all capabilities outlined in Figure A. Using an in-house or a third-party solution is not a binary choice, in some scenarios it may make sense to use a mix of in-house and third-party solution(s).
As an example, Figure B depicts the earlier workflow with modifications. Here we show that ‘Public Cloud Cost Data’ may be fed to a third-party-based solution to generate ‘Final Cost Data’ and that solution may not contain all the processing stages we describe in this document. Figure B also shows that in this example functions like ML/AI, budget forecasting is still kept in-house.
Figure B
| Process Stage | Tag Enrichment |
| Description | In this stage the public cost data record is inspected and additional tags are added. |
| Example | Add ‘environment’ tag and assign ‘prod’ or ‘non-prod’ values based on AWS account id. |
| Optional? | Yes |
| Data Input(s) | Cloud Spend and Pricing, Public Cloud Tagging |
| Persona |
|
| Output | NA |
| Next Stage | Tag Processing |
| Process Stage | Tag Processing |
| Description | In this stage the public cost data record is inspected and certain processing action(s) can be taken here to improve data quality |
| Example |
|
| Optional? | No |
| Data Input(s) | |
| Persona |
|
| Output | NA |
| Next Stage | Unblended to Amortized |
| Process Stage | Unblended to Amortized |
| Description | Many cloud providers offer schemes with upfront fees or upfront payments for resources. In this stage initial fee or payment is distributed to resources according to amortization schedule. |
| Example | |
| Optional? | No |
| Data Input(s) | Amortization schedule |
| Persona |
|
| Output | |
| Next Stage | Amortized to blended cost |
| Process Stage | Amortized to enterprise blended cost |
| Description | Large enterprises may decide to consolidate billing under a single account. Enterprise blended cost allows an enterprise to distribute all saving plans and reservation benefits across enterprises. |
| Example | |
| Optional? | Yes |
| Data Input(s) | NA |
| Persona |
|
| Output | |
| Next Stage | Normalization |
| Process Stage | Normalization |
| Description | Normalization helps compare and consolidate cloud costs across multiple providers. Additional tags added in single cloud processing can help streamline this process. |
| Example | Normalize on-demand cost in Azure vs AWS or GCP. |
| Optional? | Yes |
| Data Input(s) | NA |
| Persona |
|
| Output | Final Cost data |
| Next Stage | Assignment to cost centers |
| Process Stage | Assignment to cost centers |
| Description | In this stage cost is assigned to finance cost centers.
Some enterprises may only decide to consolidate/roll-up costs to cost centers. Others may decide to assign at row level to maintain high fidelity data for consumption in the lake. |
| Example | |
| Optional? | No |
| Data Input(s) | Finance Cost Centres |
| Persona |
|
| Output | Final Cost data |
| Next Stage | NA |
Final solution for an enterprise will depend on multiple factors e.g., budget, maturity level.
A mature enterprise with an existing process may decide to enhance current setup. Whereas an enterprise in early stages of FinOps may decide to set up a 3rd party solution to jump start their journey.
Conclusion
The implementation of an effective data workflow is essential for the success of FinOps as it drives cloud cost transparency, accountability, and cultural change within organizations. Building a single source of truth for cloud financials, where all stakeholders from finance, procurement, FinOps practitioners, executives, business/product owners, and engineering and operations teams work off the same dataset, is vital in promoting trust and informed decision-making.
An efficient data workflow establishes a foundation for data consistency, promotes a common language, automates manual processes, improves traceability, and ultimately leads to informed decision-making in cloud cost management.
By following the structure and best practices presented in this paper, FinOps practitioners can successfully implement a data workflow that drives cost optimization and fosters a culture of data-driven decision-making throughout the organization.
As you begin to engage with various personas and determine the desired outputs, there may be additional considerations for what you may want to include in your model. Some examples may include:
- SaaS & PaaS tools
- TCO Model (inclusive of private hosting, labor, and other cost pools)
- Project management tools
- Ticketing systems
While these are not within the scope of this particular paper there are other related FinOps documentation that may provide more specific guidance.
Related FinOps Resources and Framework Capabilities
- FOCUS Working Group(s): An open source specification to normalize cloud cost and usage data
- FinOps & ITAM
- KPI Working Group: More in depth details regarding FinOps KPIs (coming soon!)
Acknowledgments
The FinOps Foundation would like to thank the following people for breaking ground on this asset.

Krisztian Banhidy
Peak
Mike Kelly
Cencora
Nadeem Husain
Apptio
Sherilyn Kamga
Talend
Tom McGregor
CloudStratex
Nimesh Rastogi
John DeereWe’d also like to thank the following supporters of this output: James Gambit, Natalie Serebryakova, Sarah Storm, and Alex Landis.