Scaling Kubernetes for AI/ML Workloads with FinOps to Optimize Value
Artificial-intelligence and machine-learning projects have finally moved from proof-of-concept notebooks to production pipelines that train, tune, and serve models at scale. Kubernetes has emerged as the default control plane for this new wave of data-centric workloads: it offers declarative APIs, elastic resource scheduling, and an enormous ecosystem of GPU operators, model-serving frameworks, and MLOps add-ons.
Yet, the very elasticity that makes Kubernetes attractive can turn into a runaway cost problem. Hundreds of ephemeral training jobs, bursty feature-engineering pipelines, and always-on inference services love to consume compute, high-performance storage, and east–west network bandwidth – often long after they deliver business value.
That tension – unlimited scalability versus budget accountability – is exactly where FinOps comes in. FinOps compliments DevOps by giving AI engineers, data scientists, and finance teams a common operating model for real-time cloud cost visibility, allocation, and optimization. Embedding FinOps early in the architecture forces every scaling decision to answer two questions at once:
- Does this design meet the performance SLOs of the AI/ML workload?
- Can we afford to run it that way—today and as usage grows?
About This Paper
This paper explores how to optimize for value and achieve “elastic and efficient” when running AI/ML on Kubernetes. We begin by unpacking what makes these workloads unique, then examine the main scaling challenges through a FinOps lens and finally outline proven patterns and tooling that keep GPU clusters fast without breaking the budget.
Who Should Read This Paper
The paper will guide the FinOps Personas like Practitioners, Engineering, and Product Personas through the challenges and provide cost-effective solutions when running AI/ML on Kubernetes.
Understanding AI/ML Workloads on Kubernetes
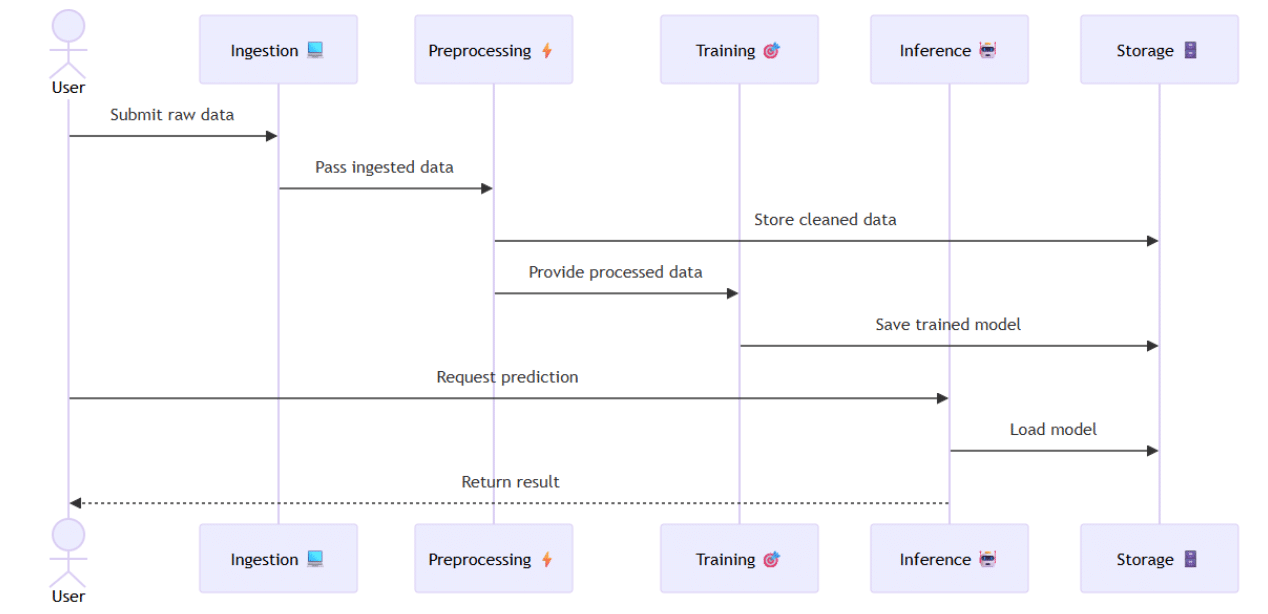
AI/ML pipelines are heterogeneous by nature. A typical deep-learning workflow may stream terabytes of raw data into a Spark or Ray preprocessing job (CPU-heavy), hand the cleaned tensors to a distributed training job that saturates NVIDIA A100 cards for hours (GPU-heavy) and then deploy a low-latency inference microservice that needs a slice of GPU or even a CPU-only node. Kubernetes excels at orchestrating this mix by abstracting each step into Pods, Jobs, and Deployments, scheduling them onto the right node pools, and scaling them independently.
- Burstiness: Training often runs in short, high-intensity bursts triggered by a new data drop or hyper-parameter sweep, leaving nodes idle the rest of the day.
- Unpredictability: Experimentation culture means data scientists spin up—and forget—clusters on demand. Capacity planning based on averages is useless; p-95 and p-99 spikes dominate the bill.
- Diverse accelerators: Modern models may need GPUs, TPUs, or even custom inference accelerators such as AWS Inferentia or Intel Gaudi. Each has its own device plugin and pricing curve.
Cost Drivers Beyond Raw Compute
While GPUs grab the headlines, three other cost drivers can quietly outpace compute if left unchecked:
| Cost | Why It Matters for AI/ML | FinOps “Gotchas” |
|---|---|---|
| Storage | Feature stores and artifact registries store many petabytes of checkpoints, embeddings, and versioned datasets. | “Just in case” snapshots and never-deleted model artifacts quickly multiply object-storage spend. |
| Networking | Distributed training frameworks (Horovod, DeepSpeed) perform heavy all-reduce operations; inference graphs may span services across Availability Zones (AZ). | Cross-AZ data transfer fees and load-balancer charges are easy to miss until the invoice arrives. |
| Licensing & Marketplace SKUs | CUDA-enabled base images, proprietary model hubs, and managed datasets may be billed per-node-hour on top of cloud rates. | These line items rarely surface in vanilla Kubernetes dashboards. |
Typical AI/ML Pipeline on Kubernetes
Kubernetes Features That Amplify (or Mitigate) Costs
Kubernetes offers primitives that can either exacerbate waste or enable surgical optimization:
- Horizontal Pod Autoscaler & Karpenter/Cluster Autoscaler grow node pools dynamically; without guardrails, they will happily scale to the maximum quota.
- Priority & Pre-emption can protect production inference from noisy neighbour experiments by evicting lower-priority Pods instead of over-provisioning.
- Resource Requests & Limits are the baseline for bin-packing GPUs efficiently; skipping them encourages the scheduler to reserve full GPUs even for light workloads.
- Runtime Classes & Device Plugins (e.g., NVIDIA, AMD, Habana) expose fine-grained GPU topology so that multi-process service (MPS) or fractional GPU sharing is possible—cutting idle GPU memory overhead.
The FinOps Consequence
The combination of bursty demand, diverse accelerator types, and hidden peripheral costs means that every scaling decision is also a financial decision. Simply “throwing more nodes” at a queue of training jobs may speed up time-to-model but will explode the monthly bill. Conversely, throttling spend by capping cluster size can push dev teams back onto laptops and stall innovation.
A mature Kubernetes-for-AI strategy therefore starts with an honest appraisal of workload characteristics and their cost multipliers. In the next section we will zoom in on the specific challenges—in resource management, autoscaling, storage, and real-time cost visibility—that make FinOps discipline indispensable for data-driven enterprises.
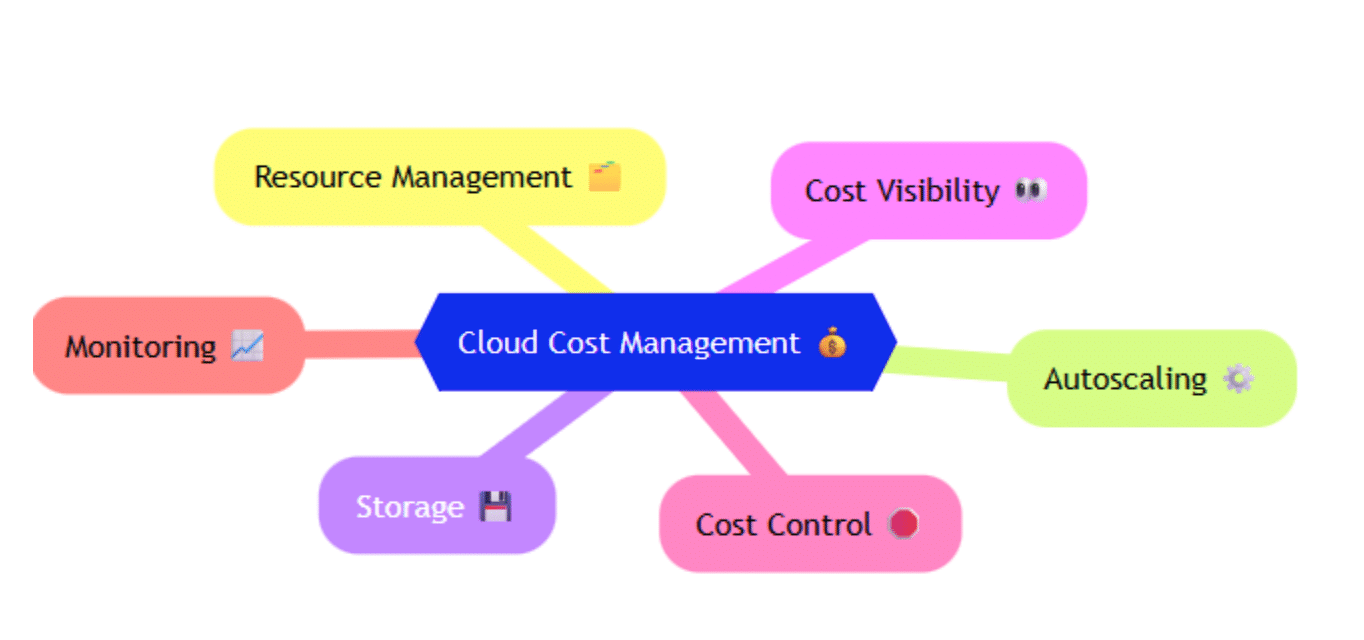
Key Challenges Through a FinOps Lens
Running state-of-the-art models on Kubernetes is technically straightforward; running them economically is harder. Below are the six pain points that consistently surface when AI/ML teams invite FinOps practitioners into architecture reviews.
Resource Management – Sweating the GPUs
- FinOps reality: A100s, H100s, Gaudi2s, or L4s can run well above £2–£5 per GPU-hour; a single week’s idle time on a 4-GPU node can quietly burn the monthly salary of a senior engineer.
- Common pitfalls
- “One-GPU-per-pod” default: Pods reserve the entire card even if the model needs only a fraction of memory or SMs.
- Zombie jobs: Failed experiments that leave the GPU daemonset alive, blocking the node from scale-down.
- FinOps-minded mitigations
- Fractional GPU sharing via NVIDIA MIG, AMD v-GPU, or Kubernetes v1.30 Device Manager, so multiple light inference pods co-tenant a single card.
- Specialised GPU node pools with taints/tolerations and strict PodDisruptionBudgets (PDBs). This isolates costly nodes and makes them easy targets for scale-down and spot replacement.
- Right-sizing templates define baseline requests at 70–80 % of peak training utilisation and let limits float higher. That keeps bin-packing efficient without throttling performance.
Intelligent Scaling – Autoscalers with a Budget
- FinOps reality: Autoscaling policies tuned solely for latency or queue depth tend to “stair-step” into the maximum quota during traffic spikes.
- Key considerations
- Dual signal autoscaling: marry SLO metrics (e.g., p95 latency, step completion rate) with cost KPIs (e.g., £/prediction, £/epoch) so the scaler understands both sides of the trade-off.
- Predictive vs reactive: Combine demand forecasts from MLOps platforms with proactive node warm-up to avoid expensive over-provisioned buffers.
- Budget caps: Implement Kubernetes VPA/ Karpenter hard limits or custom admission controllers that deny new pods if the cluster’s committed spend would breach the sprint’s budget.
Storage Economics – Hot, Warm, Cold, and Forgotten
- FinOps reality: Data gravity means storage is most of many AI bills. Checkpoint files for a 70-B model can hit 350 GB each; versioning every experiment yields thousands of objects.
- Typical mistakes
- Single-tier thinking: Keeping feature stores, checkpoints, and lineage logs all on premium SSD-backed block volumes.
- Inter-AZ transfers: Training pods in one zone pulling sharded datasets from S3 buckets in another.
- Cost-savvy tactics
- Tiered PVC classes use CSI drivers that automatically migrate objects from fast NVMe to cheaper object storage when access patterns cool.
- Artifact TTL policies in ArgoCD or MLflow so checkpoints older than n days are archived or pruned.
- Immutable dataset mirrors cache read only training data in the same zone as the compute to kill cross-AZ bandwidth fees.
Cost Visibility & Allocation – Making the Bill Actionable
- FinOps reality: Finance needs to know who spent the extra £15 k last sprint; engineers need to know why their experiment is 4× costlier than yesterday.
- Essential building blocks
- Namespace = Cost Centre conventions, enforced via Gatekeeper or OPA, so every pod lands in a tagged bucket for show-back and charge-back.
- Cost data pipes export Cloud Billing data + cluster metrics into Prometheus→Thanos or Cloud BigQuery and join on ResourceID.
- Dashboard lag ≤ 24h FinOps operates on near-real-time signals; weekly invoices are too late to change behaviour.
Cost Control & Governance – Stopping Waste Before It Starts
- FinOps reality: Ruthless governance is required because “please delete unused resources” emails never work at scale.
- Guardrails to implement
- Quota-per-team budgets using Kubernetes ResourceQuota and Cloud Budget Alerts, so excessive GPU requests are blocked at admission time.
- Orphan sweeps: CronJobs that query the API for PVCs, load balancers, elastic IPs, and disks detached from running pods > 24 h, then auto-delete or ticket the owner.
- Size lints: OPA policies that reject pods requesting instance types larger than a pre-defined envelope unless a cost-exception label is present.
Monitoring & Reporting – Blending Tech KPIs With £-Insights
- FinOps reality: Engineers optimise what they can see. If throughput, latency, and £/req sit on the same Grafana row, the optimisation conversation changes overnight.
- Implementation tips
- Unified export format – normalise cost metrics into the same dimensional model as Prometheus ({namespace, pod, gpu_model, team}) so you can use identical selectors.
- Alert pairing – tie performance alerts (e.g., “inference latency > 100 ms”) with financial alerts (e.g., “£/1000 req > target”) for contextual triage.
- Executive roll-ups – automate monthly cluster “efficiency scorecards” that blend utilisation %, waste %, and spend trend—crucial for board-level buy-in to further optimisations.
FinOps-Driven Solutions and Best Practices
FinOps enables Engineering Personas by weaving cost-awareness into every layer of the stack – from the instance catalogue your autoscaler can pick, through the admission controller that guards the cluster, all the way to the Grafana row where an engineer triages an alert. The tactics below are organised from the ground up so you can adopt them incrementally or as a full program.
Architect Node Pools for Precise Cost Allocation and Tight Bin-Packing
| Goal | Tactics | How It Optimizes for Value |
|---|---|---|
| Isolate expensive accelerators |
|
Prevents “one Pod smothers the cluster” and lets the scheduler pack multiple small inference Pods on a single device. |
| Separate dev vs prod | Label pools, e.g.
env=prod |
Enforce via Namespace selector in Network Policies and LimitRanges. |
| Design for rapid scale-down | Use small node group sizes (1-2 nodes) with aggressive TTL on empty nodes:
scaleDownUnneededTime: 10m |
Minimises the trailing half-hour of idle pay-per-second GPU billing that often dwarfs actual training minutes. |
Sample manifest (NodeSelector + Toleration)
spec:
  tolerations:
    - key: "nvidia.com/gpu"
      operator: "Equal"
      value: "true"
      effect: "NoSchedule"
    nodeSelector:
      node.kubernetes.io/instance-type: "a2-highgpu-1g" # GCP example
      workload-tier: "prod"
A simple pattern like the one above anchors every Pod to a cost-tagged node line item in your cloud invoice.
Build Intelligent Autoscaling that Understands Both Latency and Budget
Dual-signal policies
Horizontal Pod Autoscaler (HPA) v2 allows multiple metrics. Combine a business SLO metric (e.g. p95_latency) with a financial metric (e.g. cost_per_req):
type: pods
pods:
  metric:
    name: cost_per_req
  target:
      type: AverageValue
      averageValue: 0.0004 # £0.0004 per request ceiling
If either metric breaches its target, the HPA throttles replicas.
- Predictive capacity warm-up
Feed demand forecasts (Prophet, Azure SFR, GCP Recommender) into Karpenter or Cluster Autoscaler via the Upcoming Nodes API. This warms nodes 2–3 minutes before peak, so you can drop the conservative buffer that otherwise sits idle. - Budget caps and guardrails
Kubernetes Validating Admission Webhooks can query your FinOps API:
if pending_monthly_cluster_spend + pod_cost_estimate > budget_limit:
  reject("Budget cap exceeded")
The pod fails fast, prompting the engineer to request a cost-exception label.
Fleet Strategy: Harness Spot / Preemptible Instances without Risking SLAs
| Workload Class | Instance Choice | Recommended Safeguards |
|---|---|---|
| Non-critical training (hyper-parameter sweeps, nightly retains) | 100% Spot/Pre-emptible (70-90% discount) |
|
| Batch inference | Mixed On-Demand: Spot pool, e.g. 330:70 |
|
| Real-time inference | On-Demand or Reserved |
|
Implementation tips
- Use Karpenter consolidation to migrate Pods from On-Demand to Spot automatically when capacity stabilises.
- Tag Pods with an interruption-tolerant=true label; the EC2 Spot Interruption Handler or GKE’s Node Termination Handler can drain and resubmit them seamlessly.
Optimise the Storage Path – Hot, Warm, Cold, Archive
- Dynamic CSI tiering: Portworx Autopilot or Ondat Tiered Volumes can promote a dataset from (gp3 SSD) → (sc1 HDD) → (S3 Glacier) based on I/O frequency metrics automatically.
- Feature-store cache locality: Deploy near-memory caches (Redis, RocksDB) in the same AZ as inference Pods; combined with Envoy sidecars you cut cross-AZ traffic by ~80 %.
- Lifecycle rules-as-code: Embed aws s3 put-bucket-lifecycle-configuration or gsutil lifecycle set in Terraform modules, so every new bucket inherits size and age TTL rather than relying on manual cleanup.
Instrument End-to-End Cost Observability
| Layer | Tooling Pointers | What to Surface |
|---|---|---|
| Cluster |
|
£/namespace, £/node-hour, GPU utilisation %, idle vs. billable time |
| Pipeline |
|
£/run, £/successful model |
| Org |
|
Trendlines per team vs. OKR targets |
Map every metric to a single taxonomy:
<org>.<team>.<project>.<stage>.<resource>
When an engineer sees latency:287 ms and cost:£0.0006/req on the same panel, optimisation becomes a game rather than a finance chore.
Automate Idle Reclamation and Scale-to-Zero
- TTL Controller: The CNCF project controller-runtime-ttl deletes Jobs, PVCs, and LoadBalancers N hours after completion.
- Cluster-sweep CronJob:
kubectl get pvc -A --no-headers | \
awk '$6>168{print $2"/"$3}' | \
xargs -I {} kubectl delete pvc {}
This one-liner purges volumes older than a week, saving thousands per month in unattached SSD.
- Inference scale-to-zero: Knative, KEDA, or AWS Lambda GPU SnapStart can drop replicas to zero within 30 s of idle, then cold-start on demand. Perfect for spiky LLM usage.
Policy-as-Code Governance
| Policy | Example (Gatekeeper Rego) | Outcome |
|---|---|---|
| Limit GPU size |
deny[msg] { input.request.kind.kind == "Pod"
input.request.object.spec.containers[_].resources.limits["nvidia.com/gpu"] > 4 msg : = "Pods may not request > 4 GPUs" }
|
Stops a rogue experiment from ordering an 8-GPU monster node. |
| Pipeline |
Reject Pod if !has_field(input.request.object.metadata.labels,"cost-centre") |
Ensures every object rolls up to a finance owner. |
| Enforce Spot for dev | Deny any dev Namespace deployment on On-Demand | Keeps savings discipline without human review. |
Version these policies alongside application Helm charts so security reviewers and FinOps share the same GitOps flow.
Run a Continuous FinOps Loop: Measure ➜ Optimise ➜ Repeat
Pro tip: Nominate a FinOps Champion inside the MLOps guild. Someone who speaks both kubectl and ROI columns will accelerate adoption 3×.
- Daily cost digests posted to Slack / Teams with top 5 deltas.
- Bi-weekly optimisation sprints where teams tackle the worst offenders (idle GPU, over-replicated shards).
- Monthly executive scorecard – merge utilisation, spend variance, and efficiency targets; celebrate teams that beat their £/inference KPI.
- Quarterly R&D catalogue cleanup; archive stale experiments, delete orphaned buckets, renegotiate Savings Plans.
Putting It All Together
A mature AI/ML platform on Kubernetes behaves like an autonomous cost-driven organism:
- Observes demand and spend in real time.
- Decides scale actions constrained by policy and budget.
- Acts via autoscalers, node replacements, or storage tiering.
- Learns from billing feedback loops and continuously tightens parameters.
Adopting even a subset of the practices above—starting with dedicated GPU pools and cost metrics in Grafana—typically cuts 30-50 % off the first quarter’s bill without throttling innovation velocity. The next section will walk through a real-world case study where these tactics delivered seven-figure savings while doubling model throughput.
Real World Scenario: Applying FinOps Concepts
Below is a real-world scenario that illustrates how to apply the FinOps concepts and best practices discussed in the paper so far to an example production AI platform that leverages AWS EKS that we’ll call “StreamForge AI”.
Starting Point
| Metric | Baseline |
|---|---|
| Monthly EKS bill | 1.15 million (65% GPUs, 20% storage, 15% networking) |
| Average GPU utilisation | 38% |
| Model-training queue time (p95) | 41 minutes |
| FinOps Maturity | Ad-hoc tagging, no real-time cost dashboards |
In this example scenario, StreamForge ran 300+ daily Kubeflow training jobs (NVIDIA A100 ×4 nodes) plus 40 micro-services for real-time inference. Dev teams could scale freely, but Finance only saw the damage when the AWS invoice arrived a month later.
Implementing FinOps Concepts
The table below maps concrete implementation guidelines back to FinOps Framework Capabilities.
| FinOps Capability | Concrete Implementation | Tools and Technology |
|---|---|---|
| Allocation | Showback & tagging; Enforced cost-centre, model-id, and env labels via an OPA admission controller; non-compliant Pods were rejected | Gatekeeper, Kubecost, Allocations |
| Reporting & Analytics | Granular cost dashboards; Combined Kubecost allocator data with Prometheus utilisation in a single Grafana folder refreshed every 5 minutes. | Grafana, Kubecost API |
| Architecting for Cloud | Specialised node pools; Split clusters into gpu-train, gpu-infer, and cpu-batch; each had its own budget cap, taints, and tolerations. | Managed node groups, Karpenter |
| Anomaly Management | Dual-signaling autoscaling; HPA looked at p95 latency and cost_per_req (£/call). If either breached the SLO, the scaler reacted. | HPA v2 custom metric, Prometheus adaptor |
| Workload Optimization | Spot orchestration; Non-critical Ray tuning jobs moved to 100% Spot GPUs with checkpointing every three minutes. | Karpenter Spot consolidation |
| Policy & Governance | Idle-reclaim automation; Cluster-sweep CronJob deleted PVCs older than 7 days and scalers set scaleDownUnneededTime=10 m. | kubectl + Bash, Cluster Autoscaler |
| Workload Optimization | GPU visibility & rightsizing; Enabled Kubecost 2.4 GPU-metrics to surface memory/SM idle time; fractional MIG slices introduced for light-weight transformers. | Kubecost GPU Monitoring, NVIDIA MIG |
KPIs for Trend Analysis & Period Comparisons
Below are suggested real world KPIs that can be used for time period comparisons when conducting analysis to determine value from your optimization efforts.
| KPI | Desired Outcome |
|---|---|
| Total Kubernetes spend | % overall reduced spend |
| GPU utilisation | +pp increase in GPU utilisation |
| Training queue p95 | % time (min) reduced in training queue |
| Cost per 1k inferences | % improved inference unit economics |
| Node-hours reclaimed (idle) | % reduced node-hour vacancy |
What Mattered Most
- Cost visibility drove behaviour change by enabling Engineers to see cost/epoch next to “Loss” in the same dashboard; optimisation became a design goal, not an afterthought.
- Policy-as-code prevented regression – Budget caps and label checks will catch overspend before Pods hit the scheduler.
- GPU-specific telemetry unlocked big wins – Identifying sub-5 GB models hogging an entire A100 enabled MIG slicing and a drop in GPU-hour waste.
- FinOps reviews became part of the sprint demo – Every fortnight teams are enabled to show not just accuracy gains but the unit-cost impact.
Takeaways to Action Immediately
- Start with tagging & dashboards: until costs are transparent, nothing else sticks.
- Pair performance and financial SLOs: autoscalers need both to avoid over-reacting.
- Automate the boring cost hygiene: Cron-cleaners and TTL controllers pay back in weeks.
- Treat GPUs like a scarce shared service: isolate, slice, and measure them relentlessly.
This sample StreamForge scenario illustrates that it’s possible for Kubernetes to deliver elastic AI and predictable bills—if FinOps principles are woven into every layer of the stack.
The final section will recap the overarching lessons and share a call to action for embedding FinOps early in any AI/ML cloud strategy.
Conclusion
Kubernetes is the emergent best practice control plane for modern AI/ML because it delivers what data-driven organisations crave: elastic scaling, an open ecosystem of GPU add-ons, and a declarative workflow that lets small platform teams run thousands of experiments. Yet that same elasticity can turn a brilliant idea into a budget-busting surprise if costs are left to “sort themselves out.”
The journey we have mapped across the previous sections shows a clear pattern:
| Step | What You Gain | If You Skip It |
|---|---|---|
| Surface every pound, pod, and GPU in real-time | Engineers make cost-aware design decisions daily. | Finance learns about overruns weeks alter, when they are already sunk cost. |
| Wrap autoscalers in dual performance-and-budget signals | Scale happens only when it helps both latency and unit cost. | Spiky traffic or rogue experiments blast through your quota. |
| Automate hygiene– TTL, idle, shutdown, orphan sweeps | Savings accrue quietly, 24/7, with no human toil. | Dead disks and forgotten GPU nodes drain the bill. |
| Bake policy-as-code guardrails into CI/CD | Predictable spend; every deployment is pre-validated. | You rely on Slack reminders and heroic code reviews, until someone forgets. |
Key Takeaways
- Visibility first, optimisation second. You can’t tune what you can’t see.
- Treat GPUs as a precious, shared service. Isolate, slice, and right-size them mercilessly.
- Couple financial and performance SLOs everywhere. Dashboards, autoscalers, executive scorecards—if a metric matters, show its £ impact next to its latency or accuracy.
- Automate the boring parts. Clean-up automation, migration to Spot, lifecycle policies—let machines police the cluster so humans can build models.
- Iterate in short FinOps loops. Daily digests, sprint reviews, quarterly cleanup—a cadence that embeds cost thinking into normal engineering flow.
Call to Action: Implement FinOps from the Start
Whether you are green fielding an MLOps platform or retrofitting a sprawling EKS fleet, embed cost management on day 1:
- Add cost-centre labels and Kubecost (or equivalent) before the first GPU node joins the cluster.
- Define a budget-aware autoscaling policy before enabling your data-science self-service portal.
- Write at least one OPA rule that would have stopped the last expensive incident.
By making FinOps a first-class citizen—right alongside security, reliability, and velocity—you ensure that your AI-ambitions scale responsibly, sustainably, and without unpleasant surprises when the cloud bill lands.
Acknowledgements
Thanks to the following people for their contributions to this Paper:

Last updated: September 30, 2025
