Measuring Anomaly-Detected Cost Avoidance Playbook
Summary: To effectively measure Anomaly Detected Cost Avoidance, organizations must quantify the financial impact of identifying and remediating unexpected cloud spend spikes before they fully materialize. This process involves calculating the difference between the “Projected Runaway Cost”—the spend that would have occurred if the anomaly continued unchecked—and the “Actual Cost” incurred until resolution. By establishing a clear baseline of historical usage and utilizing real-time alerting, FinOps teams can demonstrate the direct ROI of their anomaly management practices to leadership.
This playbook will guide you through the process of determining anomaly-detected cost avoidance which is the amount of money you were able to avoid spending as a result of identifying and correcting an anomaly.
Formula
Total cost of the unpredicted & correctable amount of spend * Projected Amount of Days the anomaly could have occurred if the underlying issue was not addressed
Who Should Use this Playbook
This playbook should be used by FinOps practitioners or anyone interested in calculating anomaly-detected cost avoidance.
Prerequisites
- Access to your cloud console or third-party anomaly detection software (if applicable)
- Ability to see cloud usage and spend data via your CSP console or third-party provider
- Properly configured cost monitoring and alerting (i.e. cost allocation tags/labels, cost categories, etc.)
Who needs to be involved:
- Driver: FinOps practitioner responsible for reporting cloud usage and spend (Inform stage)
- Contributor: Engineering practitioner / manager responsible for cloud spend and making cost-related decisions (Optimize & Operate stages)
- Informed: Finance teams for validating the cost data and decision-making (Optimize & Operate stages)
Information and resources required:
Information
- Duration of the anomaly, i.e. how long the actual cost was above the acceptable range
- NOTE: To properly determine the cost of an anomaly, the anomaly itself must be over and the associated cloud spend back in a normal/acceptable range.
- Total cost of the service or SKU during the anomalous time period
- Upper boundary of the acceptable range of spend
Tools, Utilities & Templates
Links to tools, utilities and templates to use during the playbook.
- Operationalizing AWS CloudWatch Anomaly Detection
- Google Cloud Apigee Anomaly Detection
- Azure AI Anomaly Detector (will be retired in 2026)
Instructions
- Prep Time: 5 Min
- Create a time range coefficient for how long an anomaly would likely go undetected if it hadn’t been uncovered and resolved. This will be an approximation, and should be based on how often your organization checks cloud cost data for whichever cloud service(s) anomalies you are measuring.
- For example, if this is done on a weekly basis, a good time range coefficient would be 5-10 days. If it’s done daily, a good coefficient would be 1-2 days.
- The time range coefficient will vary between different cloud services, depending on how often each service is reviewed or monitored.
- Certain cloud services may also be owned by different teams within the organization, with different practices for regular cost monitoring. The follower of this playbook should consult those teams to determine how often they are checking and reporting costs, and create a time range coefficient based on that information.
- It’s recommended that the managers of those teams review and approve the time range coefficient as well before putting it into practice.
- Review your time range coefficient on a quarterly basis. Determine if the monitoring frequency of the cloud service has changed at all; i.e. if a service is monitored more often, its coefficient should decrease, and if monitored less frequently, its coefficient should increase.
- Calculation: 5 Min
-
- (this step may already be provided by your anomaly detection solution) Determine the actual cost value of the service that experienced the anomaly, and subtract the upper boundary of the acceptable range of spend. The difference will be the actual cost of the anomaly. Note that the actual cost cannot be determined until the anomaly has been resolved.
-
- In Figure 1, the service cost for a detected anomaly was $450, while the normal acceptable range for costs of this service at the time measured has an upper limit of $250. Given this, the actual cost of the anomaly is $200.
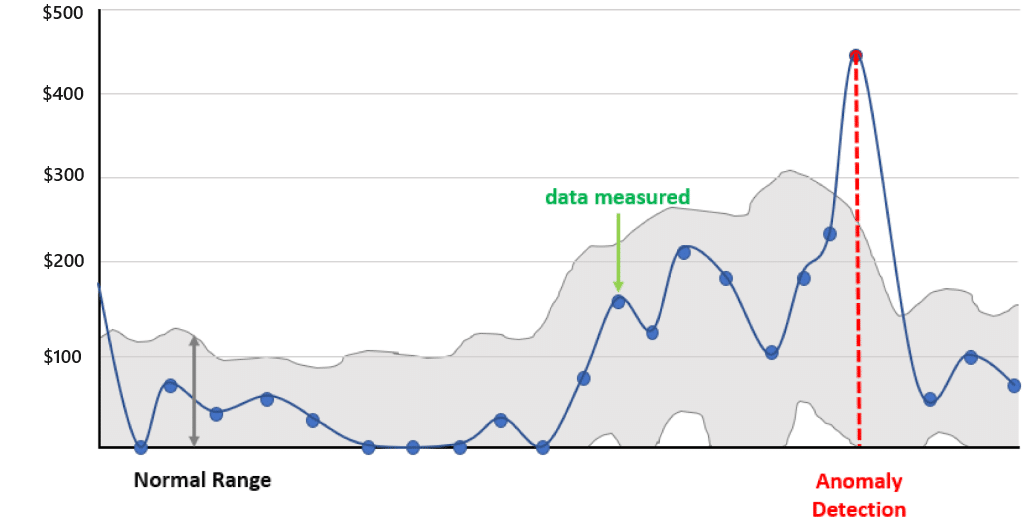
Figure 1 – Sample line chart showing daily costs of a specific cloud service over time, including the normal range of acceptable costs.
- Multiply the actual cost of the anomaly by the time range coefficient to get the final KPI of anomaly cost avoidance.
- Using the example from Figure 1, a $200 anomaly that was detected by an organization that does weekly cost checks would have a coefficient of 5-10 days, and would thus have a cost avoidance metric of $1000-2000 in unnecessary cloud spend.
Outcomes and Indicators of Success
Following the measurement of your anomalies, the total cost avoidance should be communicated to the wider FinOps team as part of regular cost reporting practices (see: “Tracking Cost Changes” in the Managing Cloud Cost Anomalies guide), as well as the rest of the cloud operations team (product managers, engineers, engineering leaders, etc.) to better inform their future infrastructure planning.
This playbook should be run on a regular basis (e.g. monthly) to assess how the organization’s cloud investments and detection software are aligning with the wider business goals. If automated, it’s recommended to do so on a daily basis.
It can also be run in aggregate over a certain period of time (monthly, quarterly, etc.) to determine how much cost avoidance you received during that period, which can then be compared to later time frames to show progress.
Primary Outcome
- The primary outcome is to get an understanding of what your cloud anomalies may have cost your organization had they not been detected. This can be helpful when evaluating services (are some more likely to generate higher cost anomalies than others?), or when determining the value of third-party anomaly detection software.
Exceptions and Considerations
- Your time range coefficient is the biggest variable in this playbook, and may be different across teams and/or services. i.e. If one service is checked more than others, its coefficient will likely be smaller, thus making the cost avoidance total lower than it might be for services that are only checked sporadically.
- Consider classifying your anomalies by root cause as part of your larger management strategy (e.g. untrained staff, rogue/untested script, etc.). Doing so will allow you to better understand the teams or services where anomalies are most likely to occur, which will help mitigate these root causes over time as the organization matures.
Acknowledgments
Thanks to the following people for their work on this Playbook:

We’d also like to thank our Supporters: David Lambert, Shiv Singh, Taylor Houck, and Brian D’Altilio.
