Managing Cloud Cost Anomalies
Summary: To effectively manage cloud cost anomalies, organizations must transition from manual, reactive firefighting to an automated, “shifted-left” approach that integrates detection directly into engineering workflows. This process involves establishing a clear definition of an anomaly based on historical patterns, utilizing real-time alerting to notify responsible owners immediately, and running a cross-functional “Lessons Learned” process to ensure individual spikes drive long-term architectural improvements. By combining advanced tooling with a culture of shared responsibility, teams can distinguish between “good cholesterol” (costs driving business growth) and “bad cholesterol” (waste from misconfigurations) before they impact the bottom line.
Table of Contents
Introduction
Managing Anomalies for FinOps is the practice of detecting and correcting cost anomalies that might occur in cloud consumption. This document aims to inform you of what anomalies are, why it’s important to address them, and what the lifecycle of managing anomalies looks like.
Benefits of this guidance
Understanding how to manage cloud cost anomalies include FinOps and organizational benefits such as:
- Learning what a cloud cost anomaly is and how it might affect your product or organization’s cost and usage efficiency
- Understanding the lifecycle of a cloud cost anomaly, from reporting one through to resolution
- Reviewing key performance indicators involved with anomaly management
- Identifying business roles and personas, whether FinOps related or adjacent, who need to be involved or informed about cloud cost anomalies
All information contained in this document has been created by FinOps Foundation Community members and based on first-hand experiences. The team expects this documentation and information to expand and deepen as it is presented to the wider community for feedback and improvements.
Cloud cost anomaly definition
Anomaly Management is the ability to detect, identify, clarify, alert and manage unexpected or unforecasted cloud cost events in a timely manner, in order to minimize detrimental impact to the business, cost or otherwise. The FinOps Foundation defines a cloud cost anomaly as:
Anomalies in the context of FinOps are unpredicted variations (resulting in increases) in cloud spending that are larger than would be expected given historical spending patterns.
Let’s unpack each part of this definition to better understand all of the nuances at play with cloud cost anomalies.
Identifying and defining all of these terms related to cloud cost anomalies allows us to better define the lifecycle of that entity. We’ll try to address each of the points before we proceed to the lifecycle, algorithm, and other interesting details of managing the anomalies.
Note: We’ve also updated the FinOps Terminology & Definitions asset on the finops.org website so practitioners can learn the terms within this documentation alongside other important concepts from other capabilities.
Unpredicted variation
It’s important to note that we are not simply talking about the “outliers” (one method of approaching anomalies), but we are actually looking to find what are the “expected” or “predicted” costs for a period, and then measure if the costs accumulated so far in the day.
The FinOps Practitioner tries to anticipate the costs for a period (typically a day, which we will discuss further), and then tries to compare it with the actual costs for the period and decide whether to panic or not! The prediction can be a single number, a range, or simply something the “computer does which is too difficult to put in words”, especially if you are using a machine learning model.
Does every variation constitute an anomaly? Absolutely not. The threshold for variation to be considered an anomaly can greatly differ based on the size and type of company, the scope of how much they use cloud, and other variables of their particular operation.
Increased Cost
Anomaly detection is not an activity to identify increases in usage patterns or to find out if some service did not run when expected. There are other places far more efficient (and more real-time) to catch those kinds of issues. Anomaly detection identified cost increases in an attempt to avoid surprise charges when the monthly bill arrives. The goal of anomaly detection is not to identify cost decreases as the collective experience of the community has shown that communicating costs below expected as anomalies just adds to the noise.
Cost-driven anomalies
Cost anomaly detection focuses on identifying deviations from an expected rate of spend. Organizations in the crawl or walk phase of anomaly detection typically focus on cost increases only. Companies just launching an anomaly detection system and processes will need to fine tune the settings and prove out their alerting/notification process. It typically takes time to improve the signal to noise level to an acceptable level of false positives.
While organizations primarily prioritize cost increases, mature (i.e. Run phase) FinOps organizations should investigate decreases as well. A cost anomaly can be an indicator of an underlying technology or business issue. For example, a misconfigured autoscaling system may cause a cost increase, or decrease if it fails to upscale. Typically, there are other systems in place to identify such issues so most organizations will focus strictly on cost increases.
Cost anomalies can be split to three types:
- Anomalous spikes in total costs: finding that the total cost of a service spiked for the past days compared to normal.
- Anomalous spikes in Cost per Usage: finding that the amount paid per unit of usage spiked – e.g,. If there is a spike in the cost per hour of compute, it may indicate an increase in on-demand vs discounted plan costs, or switch to more expensive resources compared to the increase in usage.
- Anomalous drop in unit economics featuring revenue / cost metrics: When available, the drop in the ratio between revenues derived from the cloud compute environment to the cost of running that environment is a strong indication of loss of efficiency in the way the resources are used. It can be broken down by the unit of revenue for a company (e.g., a player for a gaming company).
Historical patterns
Most anomaly detection systems utilize historical data as a basis for detecting anomalies. The systems may range in sophistication from a simple percent increase in spend to machine learning based models that understand (historical) spend patterns but are still based on learnings from historical data and lack future awareness. The downside to not being future aware is more false positives.
More sophisticated systems are future aware and include forecast (budget) and event data in their models. These systems rely on a combination of historical data and future data to determine anomalies with greater accuracy than historical data alone. Forecast data is often aggregated at a relatively high level that makes it unusable without understanding the historical patterns.
More specifically, forecasts are typically by month and the department level by resource type. Knowing that you expect compute resource costs to increase 25% for a given month over the prior year is helpful, but not sufficient as spend patterns often have variability from day to day that can be seen in the historical data, but are lost in a monthly bucket.
Other terms and definitions to know
Severity
Taking the discussion on variation further, once you have established a minimum threshold, you still need to identify a low-impact anomaly from a high-impact one. Usually it’s best if the business users have some control over what you call a low-medium-high-critical anomaly and also being able to set alerts only on the high/critical ones and leave the low-medium for offline analysis.
Also note that in a day, an anomaly may start off with low severity but as it accumulates more costs, it may escalate to a high or critical level.
Timescale
This is where the Anomaly Detection process separates itself from budgets.
Budgets are usually created and monitored on a monthly, quarterly or annual basis. This does not leave any room to find inter-day variation. We have seen the Anomaly Detection working best on a timescale of a day or consecutive days when an anomaly persists.
Importance of anomaly management
Detecting and managing anomalies is critical to avoiding unwanted and surprising billing charges. An identified anomaly could be an indicator that there is an infrastructure issue, a software bug, possible cyber attack, or any other problem that might cause a constant increase of unpredicted cloud costs.
Anomaly management is an important mechanism aiding in keeping costs on target, or at least mitigating damages, when anomalous events occur. Without anomaly management, organizations rely on chance to discover unusual spend increases- which is not a good position to be in. Managing anomalies is essential to helping organizations stay on track with regards to forecasts and budgets.
For example, a cost anomaly might indicate a heavy utilization of a certain type of resource that might exhaust its resources due to unwanted workload. Even while cloud resources are usually highly scalable and built in such a way that there are no issues with performance, there are situations where resources or service flows that might not be so resilient when facing an increased demand of performance. In this case, not only will cloud costs increase, but service levels and reliability can drop, which can negatively impact revenue or reputation.
Continuous anomaly algorithms are used by organizations to detect and flag any anomalies in their budgeting and spending patterns. If an anomaly is missed from monitoring, it can lead to inaccurate predictions and underestimations by the algorithms, which can negatively impact the organization’s growth plan. The reliability of the generated mathematical models depends on the availability of precise data, as it directly influences the quality of insights and predictions. Therefore, it is crucial for organizations to ensure that their anomaly detection algorithms are effective and regularly updated to prevent any budget overruns or financial instability.
To ensure long-term financial stability, it is necessary to strike a balance between cost-cutting measures, maintaining organizational operations, and collecting all real-time anomalies into the anomaly detection algorithms for continual re-forecasting to better understand where we will end up for every anomaly. This will provide enterprises with an indicator when an anomaly is missed and causes an overrun. It will be accounted for in the financial model without having any major last minute surprises on the growth plans.
Lifecycle of a cloud cost anomaly
Now that we have established what a cost anomaly is, let’s look at its lifecycle:
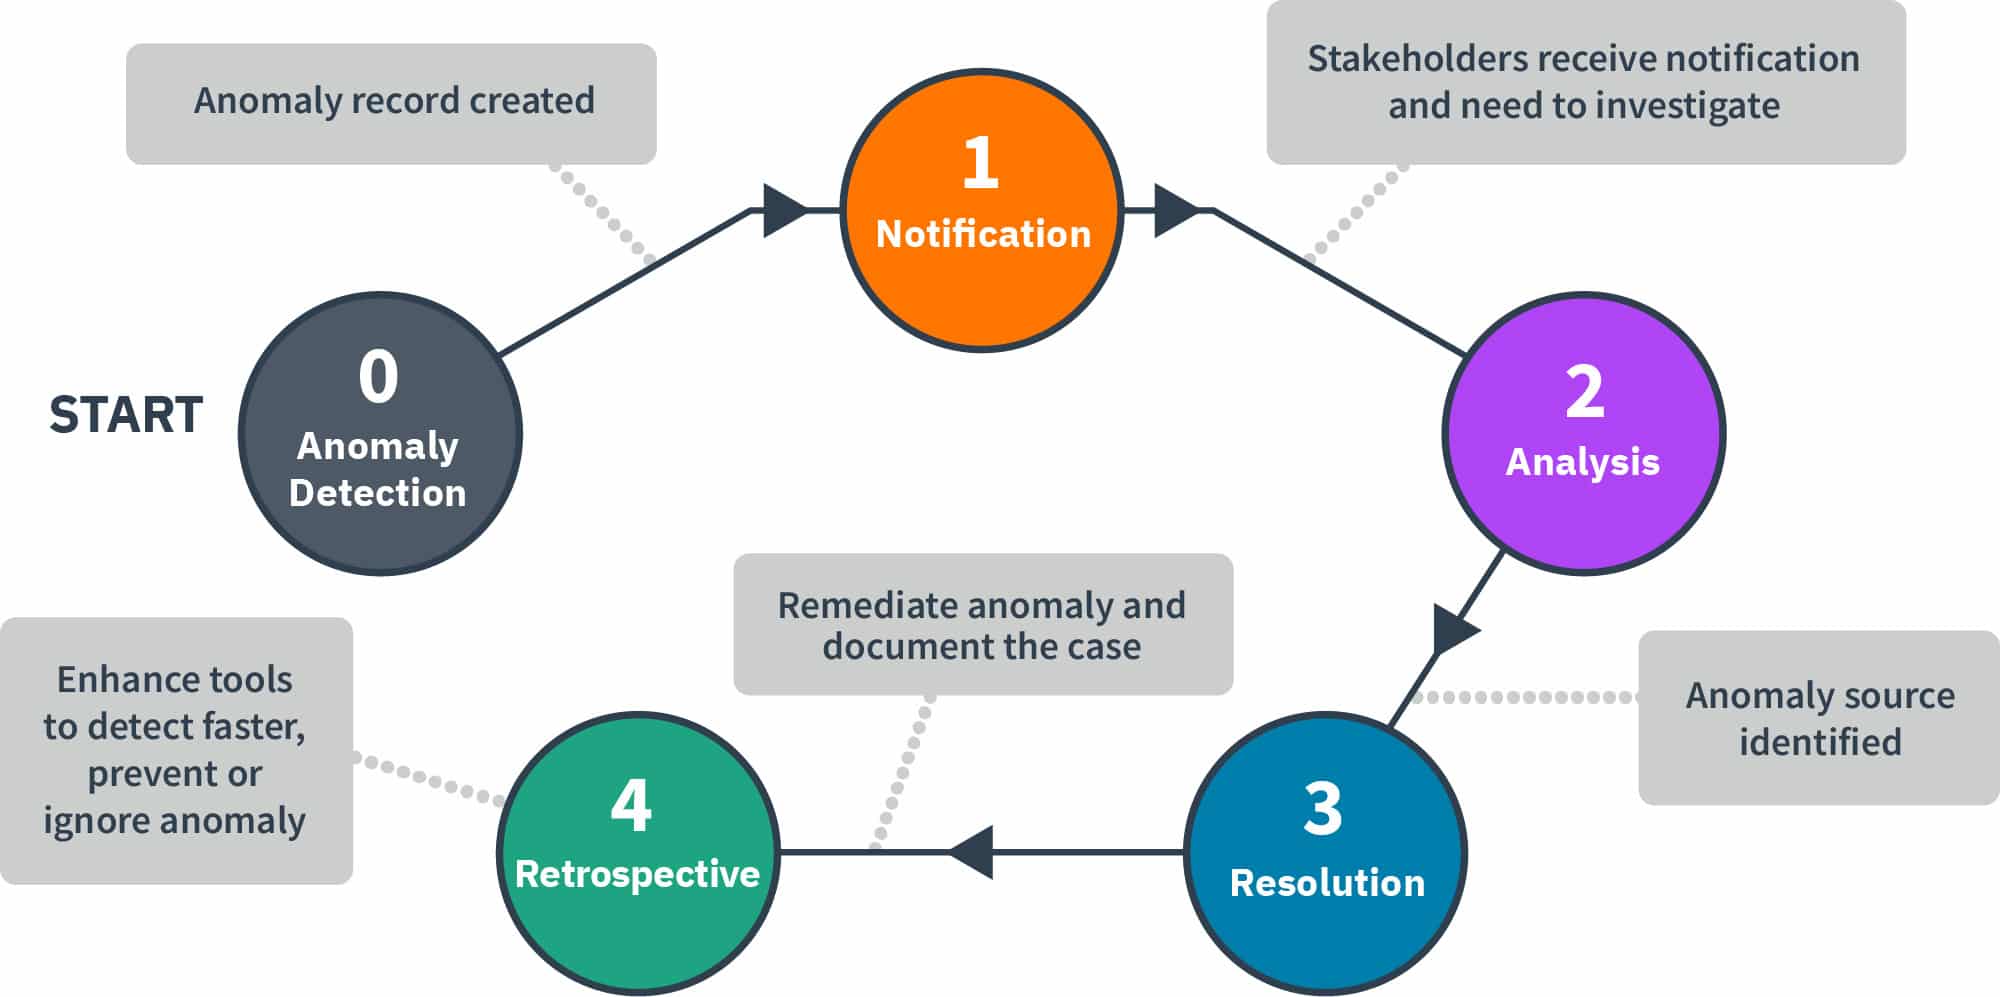
- Record Creation: This is the first step and, regardless of your algorithm, you need to systematically create a record for each identified anomaly with the characteristics (e.g. impact, service, scope) for future analysis.
- Notification: Depending on the severity of the anomaly, the mode of communication may be different (or absent). You may choose to integrate mobile / team chat alerts for “critical anomalies” and set email alerts for “high impact” ones and choose not to send notifications for medium and low ones to be analyzed weekly or monthly (this will vary from organization to organization).
- Analysis: Once the anomaly has been identified and stored, an investigation should be performed to understand the reason behind the spike in cost. During this lifecycle phase, individuals look to determine if the increased cost is in fact an unexpected increase, if this is the result of intended or unintended change, etc.,and to uncover the “why” behind what happened.
- Resolution: Deciding upon an action to take as a result of the analysis, even if the decision is to take no further action. See common resolution outcomes below.
- Retrospective: Once the Anomaly has been resolved, it’s important to perform an analysis to understand how future anomalies can be prevented, capture data to feed into KPIs (e.g. $ avoided), or even adjust the monitoring system to capture it earlier.
It’s important to note that the lifecycle steps are implemented differently across organizations. See lifecycle variations for examples on how different organizations have chosen to implement anomaly management. Labor capacity, automation, and FinOps maturity are just some of the factors which affect the implementations of anomaly management and the efficiency of the execution.
Record Creation
The first step of the life cycle, record creation, involves detecting the anomaly (and whether it is actually one) to kick off the entire process. Here we address best practices and challenges involved with anomaly record creation.
The general process of any anomaly detection method is to take data, learn what is normal, and then apply a statistical test to determine whether any data point for the same time series in the future is normal or abnormal. Let’s take a closer look at the data pattern in the figure below. The shaded area was produced because of such analysis. We could, therefore, apply statistical tests such that any data point outside of the shaded area is defined as abnormal and anything within it is normal.
Figure 1
Detecting anomalies in time series involves three basic steps:
- Estimation: Estimating a mathematical model that describes the normal pattern (and distribution of the pattern) of cost based on historical data and known future events.
- Prediction: Predicting the expected cost (and its prediction confidence interval – aka baseline sleeve) for the next measurement interval (hour/day/week/month…).
- Detection: If the next measurement of cost does not fall within the predicted confidence interval, flag it as an anomaly.
Estimation
The normal pattern over time of the cost may include effects such as: trends, seasonal patterns (e.g., daily, weekly and/or monthly patterns), normal changes of the pattern due to change of usage and effects due to known events that may impact cloud usage (e.g., known tech changes in products, holidays, product release, marketing campaigns, etc).
A model that encodes and estimates all of the above will be more accurate than a model that does not. For example, a simple statistical model for anomaly detection would estimate a 7-day running average of the cost, with its corresponding standard deviation.
Such a model accounts for slow changes (trends), but would not capture the effect of a weekly seasonal pattern and might trigger a false positive alert every Monday, if the weekly pattern exhibits lower cost over the weekend. However, a model that can encode seasonality, would not trigger an alert on Monday because it knows that Mondays are higher than the weekend.
Prediction
In the prediction phase the model considers all the data up to the previous time step (e.g., up to yesterday) and it is used to predict future cost (e.g., today’s cost). The predicted cost is then compared to the actual cost to determine if the difference is significant. Significance is typically determined using a prediction confidence interval. An event measurement is considered anomalous if it falls outside that confidence interval.
For example, using the simple statistical model of the last 7 days of average and standard deviation, the prediction is the average of the last 7 days, and the confidence interval can be average +- 3 x standard deviation – which is a reasonable interval if the underlying data follows the Gaussian distribution (aka Normal). Therefore, for anomaly detection, the model used should also have the ability to estimate an accurate confidence interval, and not just a point prediction.
Detection
If the comparison of the actual cost to the predicted cost is determined to be significant, an anomaly has been detected. When an event has been identified as an anomalous event, it is important to capture a sequence of observations related to the event to ensure the anomaly record created provides sufficient meaningful information to those who will review the record. Some of this methodology blends in with the next lifecycle step, Notification. Before we proceed, let’s take a moment to consider the challenges.
Challenges involved with identifying and resolving anomalies
Much has been discussed regarding identifying and resolving anomalies. The bulk of which can be classified into the following categories.
Signal-to-noise ratio
Most large IT environments are dynamic with ongoing development, testing, and deployment initiatives constantly starting and stopping new cloud resources. Successfully identifying anomalies is akin to finding the proverbial needle in a haystack as true anomalies often share patterns similar to normal development activities. Improving the ability to identify true anomalies is essential to any system.
Without a strategy to reduce false positives individuals analyzing anomaly records may choose to disable or ignore alerts. False positives consume critical bandwidth and therefore it is essential for anomaly detection algorithms to be carefully tuned for identifying anomalous events which are likely to be validated as true anomalies.
Identifying anomalies on a scale (low, medium, high, critical) can help organizations prioritize their response. It is important to note that a low severity alert can quickly escalate to a high or critical level as costs accumulate over hours/days.
Latency
Identification of anomalies using clouding billing details can be delayed as much as 36 hours from the start of the event and upwards of 24 hours before they are processed and made available for analysis. Short duration anomalies may be over by the time the alerting is triggered and costs can grow significantly during this timeframe for long duration anomalies.
It’s important to utilize anomaly detection even if the data is not complete as the costs will just continue to grow as the data is updated. If you take the approach of not waiting for all the cost data to be complete, the anomaly detection should be reapplied on the same data to avoid missing spikes that were not detected when the data was not yet complete. Systems that look beyond cost data and include visibility data have an advantage with early anomaly detection.
Scope/aggregation level
Large and/or multi-cloud organizations face the additional challenge of mapping anomalies to their organization structure. Forecasts and budgets are often set at the business or department level creating the need to align your cloud costs with your budget for cost based anomaly detection. You can detect anomalies at an organization level, cloud level (in case of multi-cloud), account level, and various other increasingly granular ways such as tagging.
It is a common practice to start identifying what impacts your business at large. (See below image for a comparison of cloud hierarchy structures for AWS, Azure, and GCP)
This will ensure you do not get false alarms if a service runs in another project for some reason, while it may be a flag for the project/solution owner, nothing is broken at the organization level. This will be of most interest to the FinOps teams which are centrally located. Once you have mastered the “recipe” of identifying the right anomalies, it may be time to go down to the next level of AWS Accounts / Projects. This will ensure the solution owners can also monitor their own costs and anomalies.
Figure 2
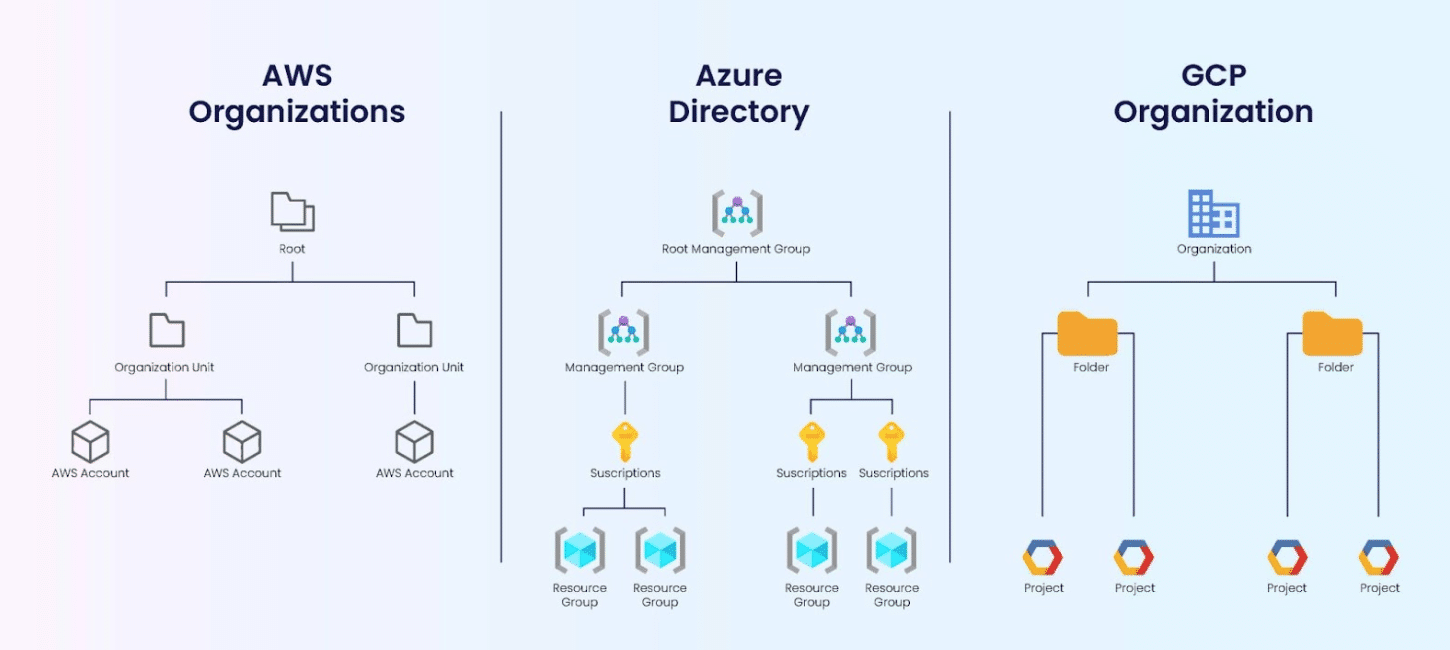
Source: Team, E. (2022, June 8). AWS, Azure and GCP: The Ultimate IAM Comparison. Security Boulevard.
Anomalies might be the result of:
- Spikes in usage resulting in a spike of costs: finding uncharacteristic increases in resource usage over a period of time compared to normal, e.g. spikes that are outside of any context or characteristic known with typical operation.
- Spikes in total costs: finding that the total cost of a service spiked for the past days compared to normal such as discovering you’ve lost commitment based discount coverage or a set of resources which are running as usual.
Anomalous events often impact important metrics such as unit economics or KPIs.
Notification
Once we have created a record of the anomaly and validated that it is one, it’s time to notify the correct stakeholders to progress through the anomaly detection lifecycle and take proper action. Many tools offer automatic alerting of anomaly events through various communication methods; email, messaging , collaboration tools etc..
Organizations find they are most successful in their analysis of anomalous events when notifications include operational context. Not all anomalies would need to be notified and thresholds for notification can be customized as well. Note that those notified often depend on the magnitude of the anomaly. For example, C-Level executives would only be notified of anomalies above a threshold set by that organization.
Notable roles who may need to be informed include:
- FinOps practitioners
- Engineering
- Product and Business Owners
- Finance
- Executives and C-Level
In a later section of this documentation, you’ll find a table of Persona Responsibilities, where the Working Group conveys which FinOps or adjacent business personas are either responsible, accountable, consulted, or informed across a number of anomaly management lifecycle phases.
Analysis
In this part of the life cycle, it’s time to take a closer look at the cloud cost anomaly. Learn more about what goes on during this phase, which personas are involved, and challenges to look out for.
Figure 3
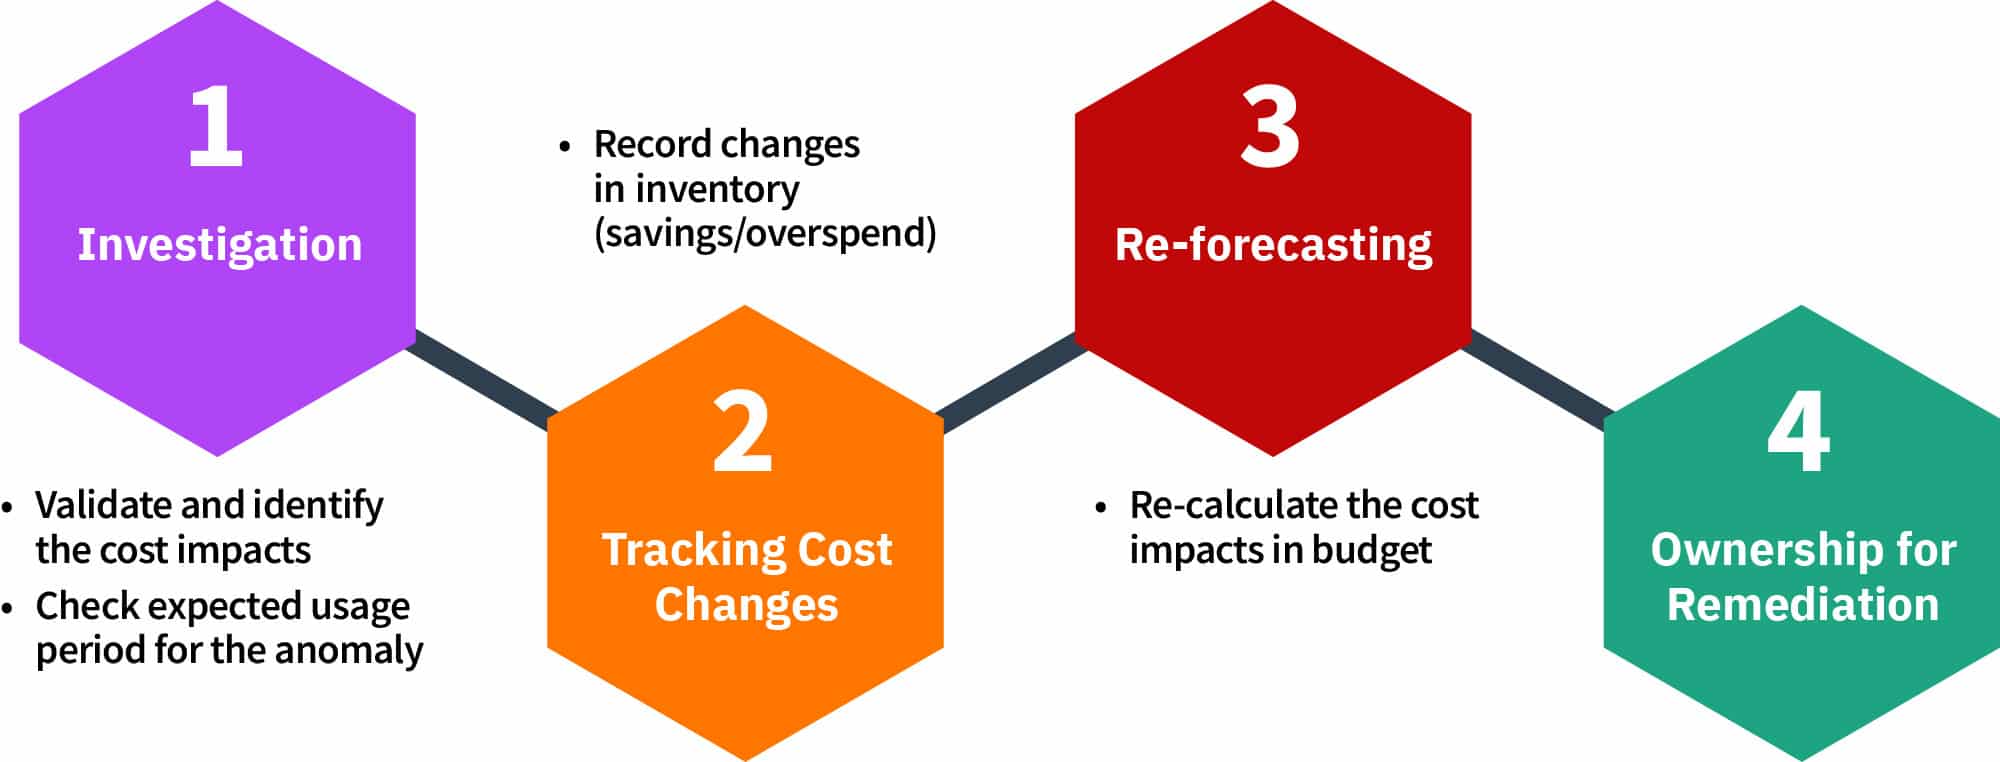
Investigation
Cloud cost anomalies once identified require triage and investigation. Initial review should consider the severity of the anomaly and the probability of the anomaly being a result of normal business activities, in order to determine the response.
Details of the anomaly, such as the trigger and run rate above baseline, should be provided by the anomaly detection system. A mature organization will have predefined thresholds dictating the response. For example a 5% increase in cost for a department might be addressed during a regularly scheduled meeting where a 100% increase would trigger an all hands on deck response.
Tips for analyzing potential anomalies
- Addressing Seasonality: Annual seasonality is recommended to be based on at least a year of data if not multiple years. A good rule of thumb for the minimum data required is having at least two cycles of a seasonal pattern in order to estimate it.
- Trends and Patterns: Ability to identify trends and patterns will enable additional filtration to allow focus on true anomalies. Therefore, the use of a confidence interval to be able to predict within that range what costs are likely and normal to occur is very helpful. For those familiar with Statistical Process, these confidence intervals can be plotted on “Control Charts” or XMR charts. One tried-and-true workflow to follow during anomaly analysis after initiating investigation includes tracking cost changes, re-forecasting, and identifying ownership for remediation.
- Consider predicted anomalies: Some organizations keep a running list of anomaly events they are anticipating. You may want to consider keeping track of such anticipated events or comparing against such a list if one exists in your organization.
- Examine contextual data provided with the anomaly record: Is this a tagging error that resulted in a false positive anomaly? Is this a one-day spike on the first of the month perhaps related to delivery time of billing charges? Is this anomaly associated with a certain environment, perhaps it is scheduled performance testing? Identifying the resource owner is often critical to assessing if an anomaly is justified or not. If your resources aren’t tagged with an owner, you may encounter delays in finding the individual responsible for the resource. While you are looking for the owner, costs continue to grow.
- Consider spending patterns: Having a baseline understanding of your normal cloud spending patterns will help you better understand seasonality and variability usage. This means gathering historical data on your cloud usage and costs to identify trends and patterns. Consider whether or not the spike in spend correlates to increased demand for resources such as “Cyber Monday” for retailers.
- Consider predicted anomalies: Some organizations keep a running list of anomaly events they are anticipating. You may want to consider keeping track of such anticipated events or comparing against such a list if one exists in your organization.
- Compare anomalous spend or anomalous spend trend to the forecast and or budget to determine severity: Is this an application or account which is tracking under budget, on target, or already trending above? How does this anomaly impact the scenario? By reporting on these anomalies, it can help bring to light gaps in communication. If infrastructure changes can be communicated to finance in advance, it will help them to more accurately make forecasts. Therefore, anomaly detection isn’t just about addressing cost increases, it is about building lines of communication about what is happening in the infrastructure.
In cases where we have a multi-day anomaly. Having separate records, one for each day of the anomaly event, would yield the following results:
- Multiple alerts for the same/related events – Treating each measurement (e.g., cost per day) as independent anomalies may lead to alerts being sent every day, confusing a user that might already be handling an issue.
- Inaccuracies with KPI reporting – The impact of an anomalous event may be underestimated, which could lead to users ignoring them – e.g., suppose an R&D issue causes an anomalous $500 per day increase in spend for a specific service. A user may ignore it because of the low impact compared to the overall spend, but after 30 days, the impact of the issue is already $15,000. Without combining all the anomalous days into a single anomaly for the user to review, the total impact may not be visible – leading to more and more waste.
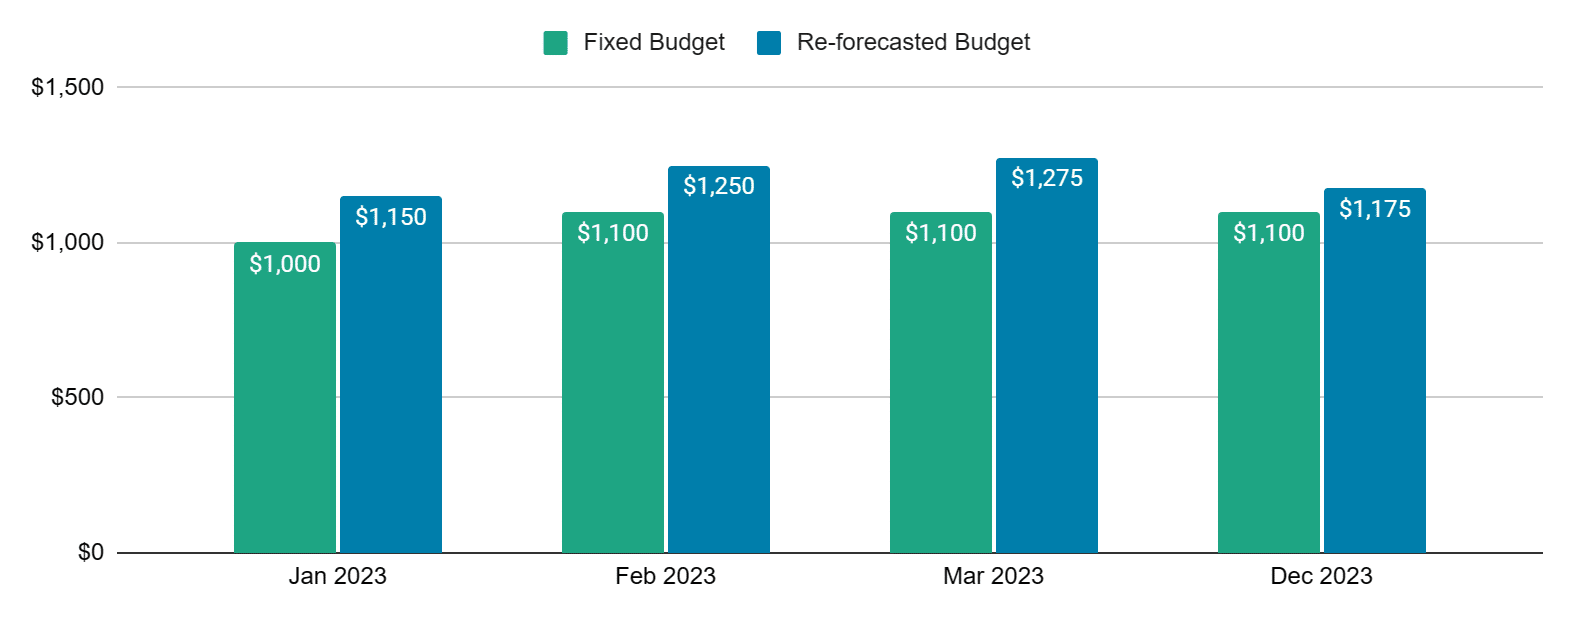
Tracking Cost Changes>
Now the cost impact ($) and expected time duration for the anomaly usage has been identified. The budget inventory’s variable forecast (seen above in chart as “Changes in budget”) is where you should attempt to note as many anomalies as you can (preferably all the alerts above your defined threshold). This will allow the FinOps practitioner to estimate the impact of the anomaly and do the re-forecasting.
Figure 4
| Jan 2023 | Feb 2023 | March 2023 | … | Dec 2023 | |
| Fixed Budget (Account X) | $1000 | $1100 | $1100 | $1100 | |
| Changes in Budget (anomalies) | |||||
| Anomaly 1 cost impact | $100 | $100 | $100 | ||
| Anomaly 2 cost impact | $50 | $50 | … | ||
| … | |||||
| Anomaly <n> cost impact | $75 | … | $75 | ||
| Reforcasted Budget | $1150 | $1250 | $1275 | … | $1175 |
For Example: Let’s consider the budget is maintained in the CSV file, then tracking anomaly changes may look as follows. With this approach at any given point in time you should be able to view the cost impacts.
Reforecasting
Figure 5
When an analysis reveals material impact to budget and/or forecast some organizations may choose to reflect those variations accordingly. Giving a re-forecast and budget impact, for example, will raise the sense of urgency for the budget owner on fixing the anomalies based on the cost impacts. In some scenarios may warrant notifying executives and the finance departments.
Ownership for Remediation
The last step of this phase is to identify the workflows required and roles responsible for resolving anomalies. We’ll dive deeper into what’s required for FinOps teams generally in the next section.
Resolution
After a complete analysis of an anomaly, a decision needs to be made as to what additional actions, if any, should be taken as a result of the anomaly and by whom. The resolution outcome depends on the findings from analysis. Below is a list of common resolution outcomes & reasoning.
Reject anomaly
After a complete analysis of an anomaly, a decision needs to be made as to what additional actions, if any, should be taken as a result of the anomaly and by whom. The resolution outcome depends on the findings from analysis. Below is a list of common resolution outcomes & reasoning.
- Dismiss anomaly – Some anomalies should be dismissed for further action. There are several scenarios in which one would want to reject an anomaly. Review the probable causes of false positives below:
- Faulty anomaly detection model: In this scenario, the anomalies do not look like anomalies at all.
- Incorrect data: In this scenario the cost data collected about the anomalous event were incomplete or incorrect leading to the creation of an anomaly record which is not valid. This sometimes occurs when the billing data referenced by the detection algorithm is incorrect.
- Expected costs spikes: Investigation concluded that the increase in spend, although anomalous in nature/quantity, was in fact an anticipated event caught by anomaly detection algorithms.
- Low impact anomalies or low priority anomalies: Cost increases may be real anomalies, but their impact is too low to require any action or the organization does not have the resources (time, people, etc.) to follow up on the anomaly event.
- Acknowledge anomaly – A sign of a good anomaly management practice is the amount of accepted anomaly records vs rejected anomaly records. While no person wants to come across serious anomalies it is preferable that the anomaly records generated are truly anomalous events so that people are not spending their time analyzing anomaly records which are eventually rejected as events requiring action. An anomaly record might be validated as an event needing further action for a variety of reasons. Below are some common scenarios.
- Security Breach: If the reason for the unusually high cloud cost was increased consumption due to malicious activity and/or a security breach, immediate action must be taken to deal with cost and the security issue. The FinOps team must work closely with the cloud security team to address the security breach in addition to dealing with increased cloud costs.
- Misconfiguration: If the reason for the unusually high cost was increased consumption due to misconfiguration of services, action must be taken to reconfigure the services. In addition to reconfiguration based on actual needs, a team may also benefit from some training on how to properly configure their needs in the future to prevent any future anomaly.
- Unintentional Provisioning of Services – Shut down provisioned services. Can controls or processes be put in place to minimize unintentional provisioning?
In any case, a decision needs to be made regarding what should happen next. You may conclude no further action is necessary or that you need to engage with an engineer to shut down an out of control resource or perhaps you need to notify multiple individuals in your organization regarding a likely security breach.In scenarios where the anomaly events threatens the ability to stay on budget we suggest you notify the budget owner and engage with relevant product and engineering teams on cost optimization opportunities to mitigate budget overages.
Retrospective
During the retrospective phase organizations should reflect on what went well, what didn’t go well, and what can be improved in the future. The goal is to identify areas of improvement and to implement changes that will improve anomaly management. Retrospectives should be scheduled on a regular cadence such as monthly or quarterly or annually and may even need to take place out of sync with the regularly scheduled cadence as necessary.
The retrospective should include the key players that receive, analyze and remediate anomalies. Whomever is leading the retrospective, should distribute a list of anomalies ahead of time that will be reviewed during the meeting. The team should consider if all anomalies will be reviewed or if there is a certain threshold that warrants deeper analysis. It’s important to make sure that everyone on the team understands the purpose of the retrospective and is prepared to provide constructive feedback.
Retrospectives are most effective when all stakeholders share open and honest feedback. An effective method for evaluating existing processes is the “Start, Stop, Continue” discussion exercise during which participants identify actions that should be newly implemented, stopped or continued. Tooling and methods should be considered during retrospective as well.
Once the team has identified the anomaly management changes to implement they should develop an action plan for completing the implementation of the changes. Conducting regular retrospectives helps drive continuous improvement into your anomaly detection and management processes.
Detection examples across FinOps maturity levels
Crawl
Figure 6
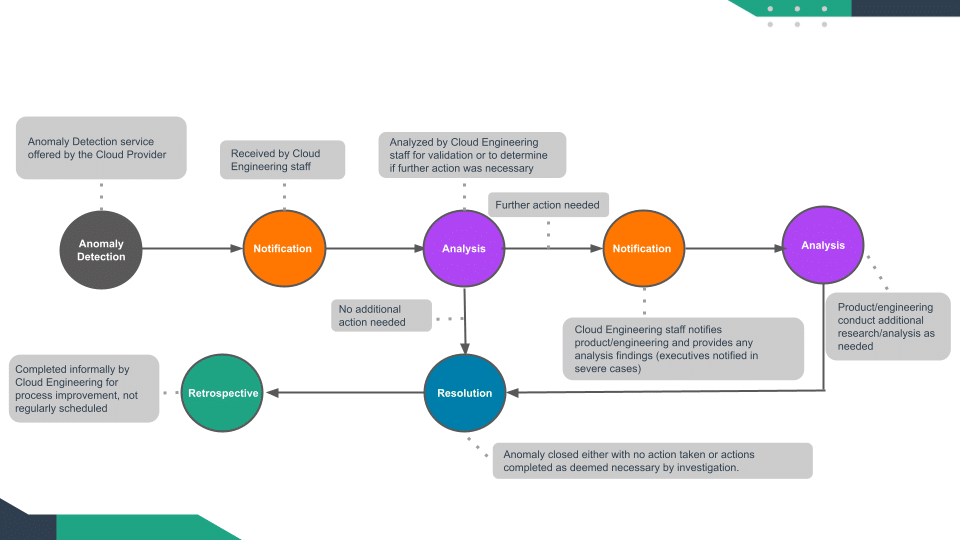
- In the crawl phase, anomalies are typically identified using visualization of costs using dashboards or applications utilized in limitation or may be identified by a system which sends a notification of the event to an individual
- Typically, anomalies are identified at higher level aggregation (account, BU or region level)
- Members of the FinOps team identify anomalies visually, drill down to see which BU/Team may be responsible for the increase in cost and notify the team to review and check the anomaly
- Anomalies are limited to obvious and high impact variations assessed against a standard set of KPI
Walk
Figure 7
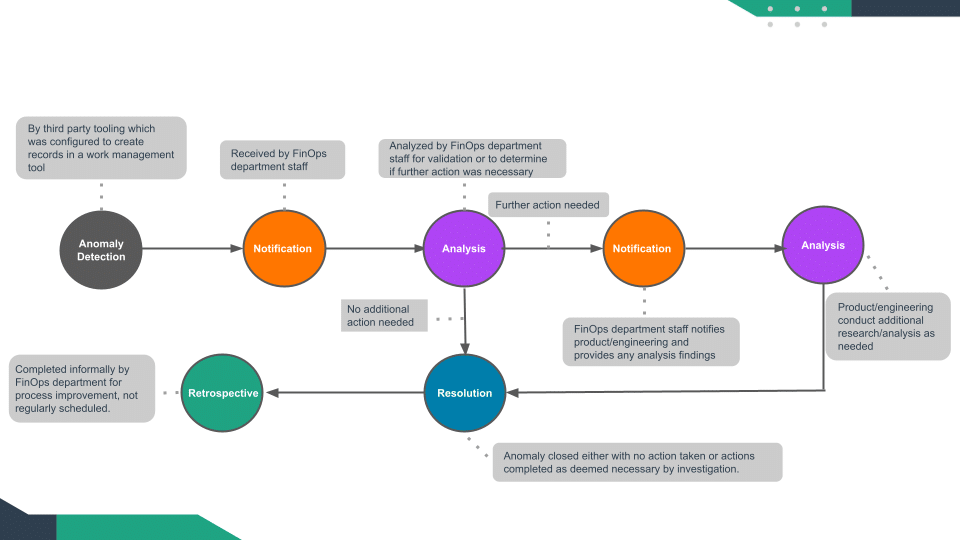
- In the walk phase, anomalies are identified automatically using basic statistical rules. For example, an anomaly will be detected if today’s cost is higher than last week’s average plus 3 x last week’s cost standard deviation.
- Anomalies can be identified at lower granularity (e.g., BU + region + service name) – depending on the false positive rate (see evaluation below).
- Alerts are sent to members of the FinOps team on identified anomalies.
- Members of the FinOps team notify the relevant BU/team on the anomalies.
- Some degree of automation in terms of alerts, visual dashboards etc are available and any applications are utilized in a more integrated manner.
Run
Figure 8
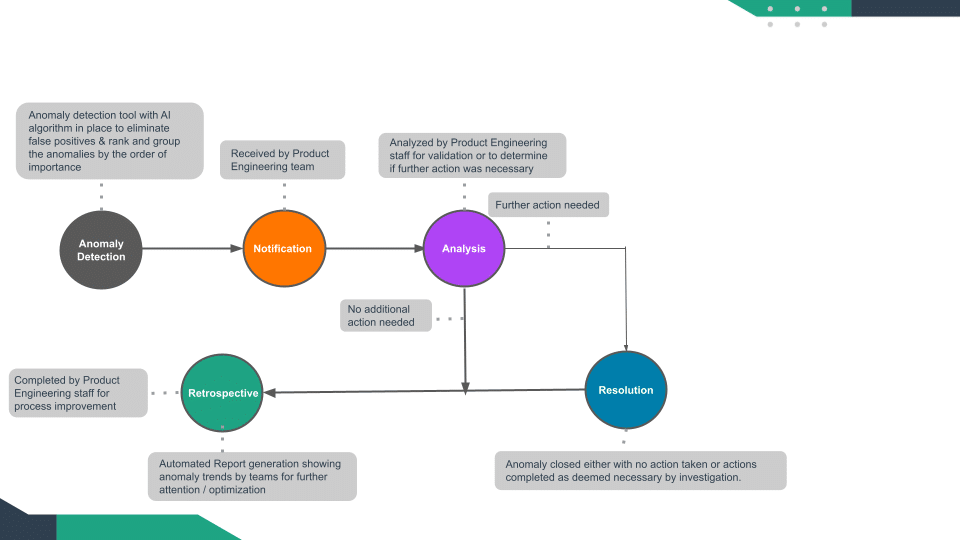
- Anomalies are identified using ML algorithms that automatically account for: trend, normal changes, seasonal patterns, special events (holidays/product releases/etc), and any type of time series behavior.
- Systems and applications incorporate data and are forecast and event-aware.
- Anomalies are identified at any granularity and can be rolled up to an organization level or drilled down to individual resource level. Users can define the minimum impact of an anomaly to be alerted on.
- Regular reports showing trends in cost anomalies for different teams (or other breakdown). These trends help identify teams that may require further training on optimizing costs or areas in the infrastructure that require further attention (beyond the single anomaly).
- Alerts are routed automatically to the relevant BU team members for further investigation and remediation in an automated manner utilizing chat, slack, email or integrated into sprint planning applications like JIRA
- Run models not on just cloud costs but on calculated KPI’s based on cloud costs such as Unit Economics metrics and costs to serve – this is so finance can improve forecasting and adjust to anomalies without it being a surprise on the bill.
| Maturity | Crawl | Walk | Run |
| Data Ingestion and Normalization | Data is not normalized fully. Still dependant on spreadsheets | Data is normalized and some amount of ongoing validation in place | Fully normalized and automated validations in place |
| Tools and Techniques – Detection | Rudimentary utilization of applications or dependant on manually reviewed dashboards, reporting and analysis etc | Anomalies detected using basic statistical rules and analysis; week over week comparison, current cost > last week’s daily average plus 3X last weeks cost SD | Utilization of AI/ML with ability to clear out the noise from trends, spend patterns, anticipated special events etc., and might include built in forecasting capabilities in anomaly detection based on unit economics spikes |
| Tools and Techniques – Workflow/ Automation | Visualized and alerted using manual and direct communication such as chat, email etc | Alerts delivered through API connections to communication tools with ability to include resolution and comments | Alerts not only delivered via API connections but also added to sprint cycles for any resolutions, ability to set exclusionary events from detection |
| Scope/aggregation level | Identified at higher levels – Account, Landing Zone or BU levels | Identified at lower levels – BU+ region + service name | Identified at any granularity with drill down and rollup capability; Org/ BU/Account/ Resource utilized |
| Personas | Limited to members of Finops team; drill down further to identify owner and notify team to review | Alerts are sent to FinOps team members who further send notifications to resource owners | Automated alerts sent to resource owners |
| Variation | Every variation is defined as an anomaly; Only the biggest or most impactful variations are reviewed using the rudimentary manual process | An awareness of variations and cost patterns are detected; prediction of variation is manual and most likely post impact | Automation capabilities include tagging recurring trends and patterns thereby allowing focus on true anomalies. Anticipated spikes due to special events are tagged and addressed prior to event occurrence |
| Latency | Monthly | 2-3 days delay | Near real time ( < 12 hrs) |
Modeling cost anomalies is a crucial aspect of cost management and analysis for any organization. Cost anomalies refer to unexpected or abnormal cost variations that are not in line with the expected patterns of costs. There are several different ways to model and identify cost anomalies.
Threshold-based cost anomaly detection – this method works by setting thresholds for expected costs and triggering alerts when the actual costs exceed or fall below those thresholds. The thresholds can be set based on historical data or predefined budget limits. For example, if the cost of a particular service is expected to be $1000 per month, a threshold of $1200 may be set to detect any unexpected increases. Similarly, a threshold of $800 may be set to detect any unexpected decreases. When the actual cost crosses these thresholds, an alert is triggered, indicating a potential anomaly in cloud cost. Threshold triggers can be based on multiple metrics ranging from an absolute value as in the example above to a percentage increase, or decrease, of a budget or historical run rate.
The advantages of threshold-based cloud cost anomaly detection are that it is easy to implement and provides quick insights into cost anomalies. However, this method has some limitations as well. It requires a significant amount of historical data to set accurate thresholds, and it may not be effective in identifying anomalies that occur gradually over time. Additionally, it may generate a large number of false positives, resulting in unnecessary alerts and wasted resources.
Though there are the limitations described above, threshold-based cost anomaly detection is a useful technique that can help organizations to manage cloud costs effectively and prevent unexpected expenses. This can be useful for organizations just starting out or ones that have relatively stable demand.
Statistical analysis-based cost anomaly detection is a statistical method that provides a more sophisticated and nuanced approach to identifying cost anomalies than a threshold-based system. Statistical analysis involves analyzing data patterns to identify deviations from the expected behavior. Variations in cost can be analyzed in the context of standard deviations with alerts being triggered if a limit is exceeded. This can be done through techniques such as regression analysis, time series analysis, and hypothesis testing.
Statistical-based models do have some drawbacks including the assumption of normal distribution inherent in statistical models. Cloud cost data often exhibits non-linear and non-normal patterns due to various factors such as seasonal variations, and unexpected spikes in usage. Statistical models may struggle to accurately capture and account for these complex patterns, leading to false positives or false negatives in anomaly detection.
Additionally, statistical models typically require a significant amount of historical data, making them less adaptable to changing environments and evolving cloud usage patterns, potentially limiting their effectiveness over time. This method can involve more time and resources to administer than a threshold based model.
Machine learning-based cost anomaly detection – ML is emerging as a powerful tool for modeling cost anomalies. Machine learning algorithms can analyze large volumes of data to identify patterns and relationships that may be difficult or impossible for humans to detect. By training machine learning models on historical data, organizations can develop predictive models that can anticipate future cost anomalies and suggest strategies for avoiding or mitigating them. Machine learning can also be used to identify anomalous data points that may indicate fraud or other types of malicious activity.
The machine learning method provides a powerful and flexible approach to identifying cost anomalies. Machine learning algorithms learn and adapt over time, improving their accuracy as they are exposed to more data. In theory, a future aware ML model offers the promise of providing highest accuracy of the various cost anomaly detection models. The downside to ML based systems is that they typically require access to more data and compute power than threshold or statistical analysis based systems which can increase the operating costs.
Build vs. Buy
FinOps teams face a decision between building their own solution or buying a pre-existing one. Both options have their advantages and disadvantages, time to market is a crucial factor that needs to be considered. Time to market refers to the speed at which a product or solution can be developed, tested, and brought to the market or implemented within an organization.
Building cost anomaly detection software from scratch offers the advantage of customization. Organizations can tailor the solution to their specific needs and requirements. However, this approach typically involves significant time and effort in terms of development, testing, and deployment. The organization needs to assemble a skilled development team, allocate resources, and spend time on research and development. As a result, the time to market for a custom-built solution can be quite long, potentially delaying the benefits and insights that anomaly detection software can provide.
Buying a pre-built, most likely SaaS-based, cost anomaly detection solution significantly reduces time to market. FinOps teams can quickly connect to their cloud environment and start leveraging its benefits. The software has already undergone development, testing, and refinement, so organizations can skip the initial stages of building a solution from scratch. Additionally, pre-existing solutions come with customer support and ongoing updates, which further streamlines the implementation process.
Machine learning is quickly becoming a standard part of a cost anomaly detection solution adds complexity to the build vs. buy decision. Machine learning algorithms enable the software to analyze historical cost data, identify patterns, and detect anomalies in real time. While it is possible to use open-source ML solutions or leverage ML APIs, the area is rapidly evolving. Leveraging a pre-built detection solution from a vendor with a strong R&D budget ensures that you will always have access to the latest capabilities and avoids the need to have expertise in developing and fine-tuning algorithms specifically for cost anomaly detection.
Building your own cost anomaly detection software offers customization opportunities, it can lead to a longer time to market due to the need for development, testing, and deployment. Buying a pre-built solution allows for faster implementation, but organizations may need to compromise on customization to some extent. The decision ultimately depends on the organization’s priorities, resources, and time constraints. Conducting a thorough cost-benefit analysis, considering the specific needs, and assessing the available options are crucial steps in making an informed decision about whether to build or buy cost anomaly detection software.
Unit Economics and cost anomaly detection
By incorporating unit economics into cost anomaly detection, businesses can greatly enhance the accuracy of their anomaly detection algorithms. This approach goes beyond relying solely on future events or cost forecasts, which often lack the necessary granularity to eliminate false positives from occurring. By considering unit economics, which encompasses actual business demand, and calculating the cost to serve in near real-time, it becomes possible to minimize false positives.
One illustrative example is a holiday sale, which typically leads to a surge in web traffic and necessitates scaling up cloud resources to meet the increased demand. If a cost anomaly detection system takes into account the cost to serve (i.e. take an order from a customer), it will notice that unit costs remain stable even as overall cloud costs rise. In contrast, systems that do not consider granular forecasts or unit costs may incorrectly identify an anomaly, resulting in a false positive. This demonstrates the importance of incorporating unit economics to accurately assess cost anomalies.
A word about CSP native tooling
All major CSPs offer some form of native tooling. These CSP native tools are designed to provide a quick and easy way to configure cost anomaly detection, but they generally offer capabilities limited to cost and usage recommendations, alerts for cost spikes, etc..
CSP native tooling for cost anomaly detection is typically threshold-based. This approach may work well for organizations with smaller or relatively stable cloud footprints, where cost patterns are predictable and thresholds can be easily defined. >They may also supplement through utilization of home grown data analytics reporting applications.
However, for dynamic environments with fluctuating workloads and complex cost patterns, CSP native tooling may not be sufficient. In such cases, third-party solutions can offer more advanced modeling and detection capabilities, often incorporating statistical and/or machine learning techniques.
These third-party solutions leverage sophisticated algorithms to analyze historical cost data, identify patterns, and establish baseline cost behavior. By building models based on these patterns, they can detect anomalies that deviate significantly from expected cost patterns. Statistical methods can be used to identify anomalies based on deviations from mean or standard deviation, while machine learning algorithms can learn from historical data to identify complex cost patterns and anomalies.
While CSP native cost anomaly detection tools are convenient and suitable for simpler cloud environments, organizations with dynamic workloads and complex cost patterns may benefit from using third-party solutions. These solutions offer advanced modeling and detection capabilities, incorporating statistical and machine learning techniques to identify anomalies in cost behavior. Moreover, they provide a unified approach for managing multi-cloud environments, streamlining configuration and monitoring processes.
Key Performance Indicators (KPIs)
There are many measurements that can be take place in the context of anomaly detection which might vary from case to case, and to the maturity of the organization, here are some Key Performance Metrics (KPI) as examples:
- Number of Anomalies – The count of anomalies within a period of time
- Anomalous Cost- The increased cost associated with the anomaly record for the given period of time
- Detection Time – Time between when the anomaly occurred to when the anomaly was detected by systems/tools/etc.
- Notification Time – Time between when the anomaly occurred and when someone received the notification.
- Resolution Time – The time between when an anomaly notification is received and until the anomaly record has been addressed (either dismissed or all response actions complete)the length in time for resolution of the anomaly
- Analysis Time – Time between when an anomaly notification is received and when the analysis is complete. his might include the investigation done by the several teams involved in the analysis before a final resolution decision is made
- Total Cost Avoidance – Cost Avoided by fixing the true positive anomaly until next billing cycle. This could be by anomaly and/or consolidated (total, per product, per department).
- Accepted records – The count of anomaly records which are determined as needing additional action
- False records (count or percentage) – Amount alerts identified as false positives
- Impact of anomaly detection ($) = Cost value of true positives (in $) – (Cost of False positives + Cost of False Negatives ($) + Cost of anomaly detection)
Most of the metrics can be categorized and measured on an application, department, product and/or organization level for more granularity and identify if there are any major outliers (for example a specific product that is more prompt to generate anomalies, or a department that needs further education).
Let’s dig into one of the above KPIs as an example: the impact of anomaly detection.
In general, evaluating the quality of an anomaly detection model (or system) requires measuring the rate of true positives vs false positives, e.g., how many true anomalies were detected vs how many anomalies were wrongly predicted as anomalies. For FinOps organization, an anomaly detection model or system should be evaluated not just based on these two measures of accuracy but also based on the impact of those anomalies and the cost in detecting anomalies in the first place. The impact of anomaly detection can be calculated as follows:
Impact of anomaly detection ($) = Cost value of true positives (in $) – (Cost of False positives + Cost of False Negatives ($) + Cost of anomaly detection)
The impact of false positives is measured as the cost of time wasted until the anomaly is determined to be a false positive. It is harder to compute exactly, therefore it is recommended to measure it for a few cases and use the average time to translate it to a cost estimate based on a standard hourly rate.
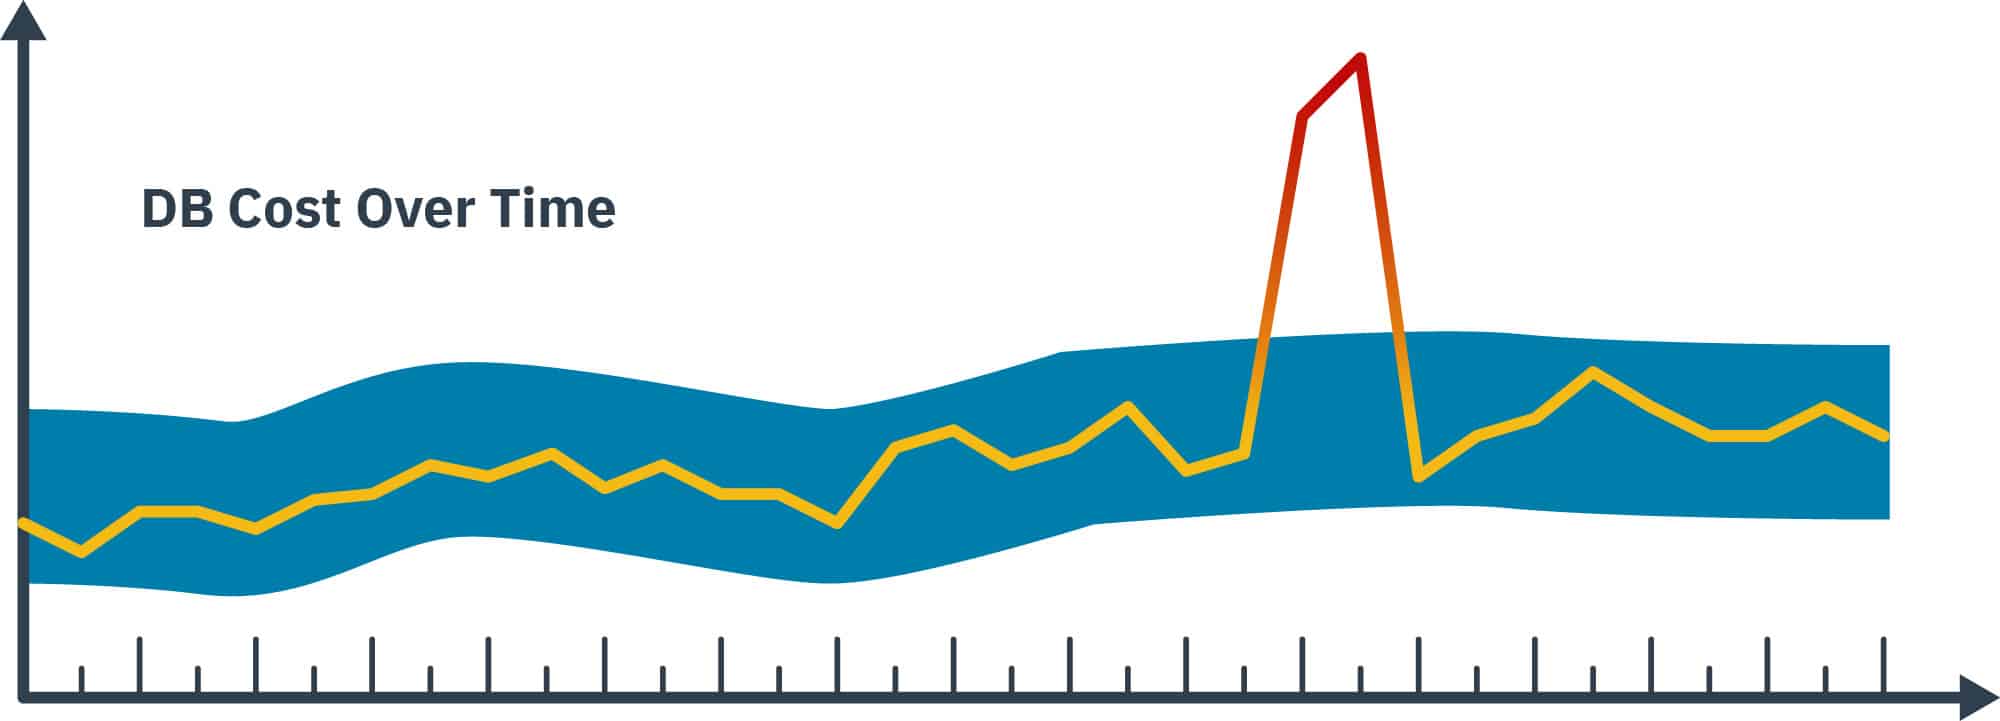
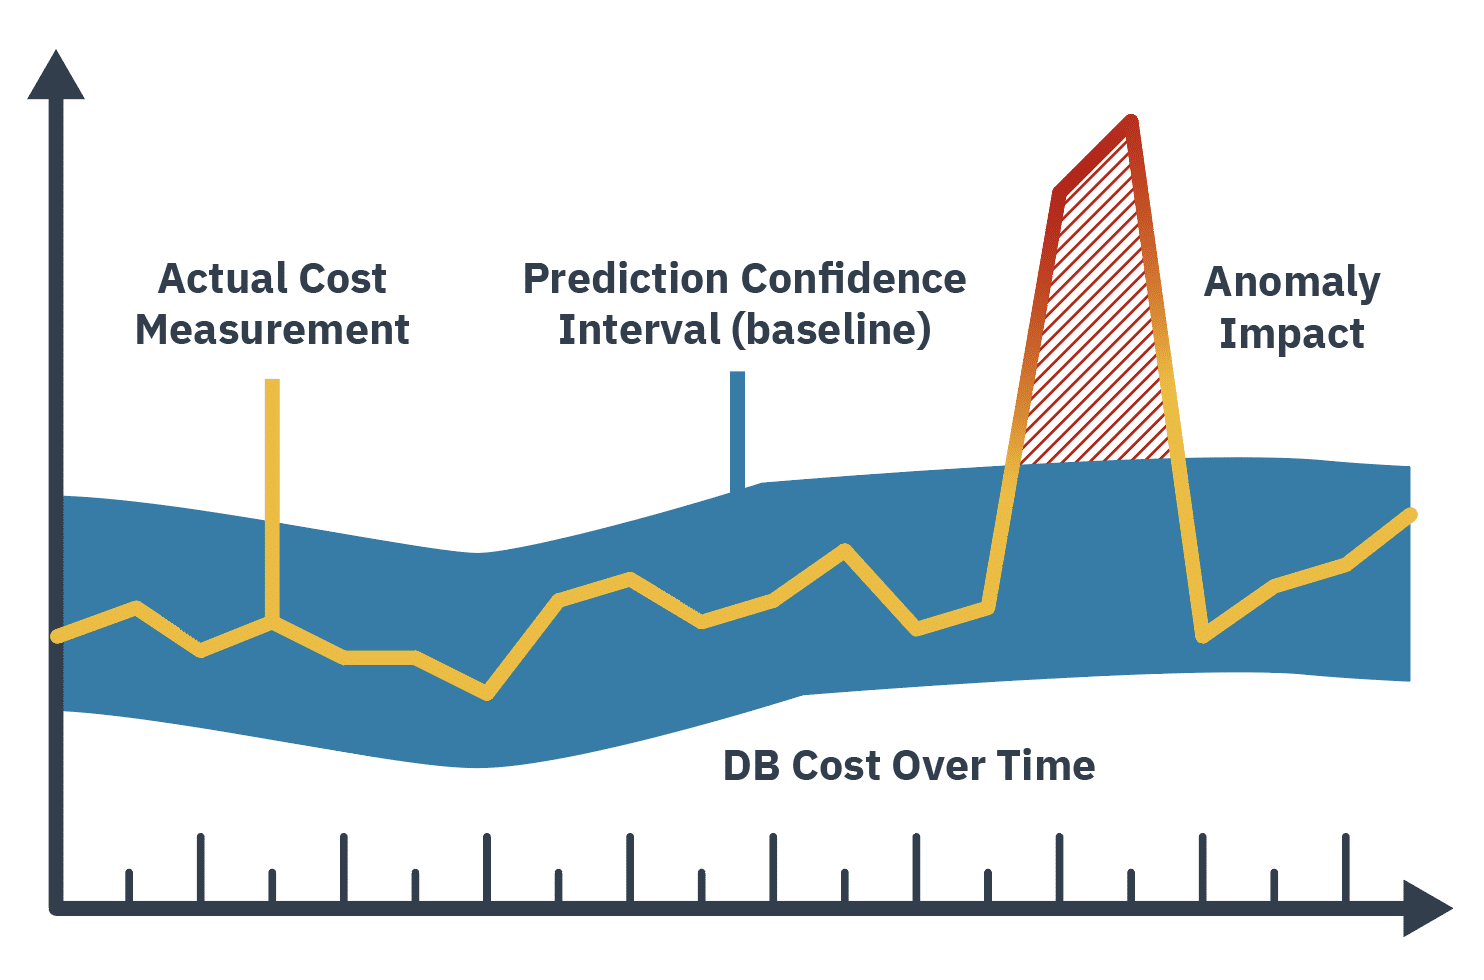
The impact of true positives is measured by the total cost these anomalies represent. For example, an anomalous increase in cost of an DB service was deemed to have been caused by a badly formed SQL query. The impact of the anomaly is the excess cost, above the expected range, of the DB cost metric. The figure below illustrates the impact of an anomaly – as the area between the expected range and the actual cost measured.
Figure 9
 The third component of the impact of anomaly detection formula measures the cost of anomalies that were not detected by the anomaly detection system/methodology that were later detected by chance resulting in increased cloud costs.
The fourth and final term in the equation is the cost of detecting and responding to the anomalies themselves. This portion of the equation should consider the cost of involved persons’ time and if applicable the cost of any tooling either built or bought for anomaly detection and management.
FinOps Personas and their responsibilities
Anomaly detection and resolution require all FinOps Personas to work together for effective anomaly identification and resolution. With multiple stakeholders, it’s important to define their Role and Responsibilities in different stages of Anomaly Lifecycle. Here’s the working model the group used to define roles and responsibilities:
| Responsible (R) | Person/Team who will be assigned the specific task to see to its completion, e.g. they ultimately own the work and outcomes. |
| Accountable (A) | Person/Team who takes ownership of execution of the task within certain established KPIs; The accountable is the ultimate owner but it can delegate the action to the Responsible. |
| Consulted (C) | Person/Team who can provide the details and actions related to the task. |
| Informed (I) | Person/Team who gets updated with the status and progress of tasks at different stages of the life cycle. |
FinOps Personas share the above roles as follows:
- FinOps Practitioner: They act as the manager throughout the entire anomaly detection and resolution lifecycle working closely with all other personas. They take accountability starting from anomaly record creation, notification, analysis, resolution and retrospection. They also keep others accountable to their tasks by keeping everyone Informed at different stages of the lifecycle.
- Product: Business owners should work closely with engineering teams, to ensure accountability for the resolution of the anomalies. They also share the responsibilities with engineering on analysis and retrospective stages of the lifecycle and they are consulted during anomaly analysis by the FinOps Practitioner.
- Engineering: Engineering implements and maintains all applications, so they are responsible for anomaly record creation, its analysis, resolution and retrospective. They are also consulted along with business owners during anomaly analysis by the FinOps practitioner.
- Finance: Finance teams are responsible for the cost allocation and budget forecasts, so they are accountable for reforecasting budgets due to increase in baseline cost due to anomalies. They also will be consulted and informed throughout the Lifecycle of Anomalies.
- Leadership: Executives are the sponsors and accountable for anomaly detection and resolution to maintain budget discipline. They oversee how effectively teams manage anomalies through KPIs produced by other personas at various stages of the cycle.
The following table summarizes the personas and their roles during each step of the life cycle. It can greatly depend on where you are in your FinOps maturity.
| Lifecycle step | Task |  FinOps Practitioner |
 Product |
 Engineering |
 Finance |
 Leadership |
| Record Creation | Anomaly Definition | R | C | C | C | A |
| Record Creation | Tool Setup/Maintenance | A | C | R | I | I |
| Notification | Notification Criteria/ThresholdDefinition | A/R | C | C | C | I |
| Analysis | Anomaly Ownership Identification | A | R | R | I | I |
| Analysis | Anomaly Analysis | A | C | R | I | I |
| Analysis | Reforecast | R | C | C | A | I |
| Resolution | Remediate | I | A | R | I | I |
| Resolution | Remediate | I | A | R | I | I |
| Resolution | Document Anomaly | A | R/C | C/R | C | I |
| Retrospective | Measure, reflect & improve | A | R | C | C | C |
* Roles swap depending on assignment
Intersecting FinOps Capabilities
To build a solid FinOps Framework, capabilities (such as Anomaly Management) don’t work as standalones and have intersections with other capabilities of the Framework. While typically it’s the same team working in most of the capabilities, it’s important to highlight these intersecting points to establish a mature process and governance.
The following table should cover the main intersection points between Anomaly Management and other capabilities, it includes a quick description and which inputs the other capabilities are expecting to receive from Anomaly Management, and what Anomaly Management should be getting.
| Capability | Intersect with anomaly management | Input (from Anomalies) | Output (to Anomalies) |
| Cost Allocation | Ensure extra expense is allocated to those accountable | Assign the anomaly cost to a cost center (unit, department, team, product, etc) | None |
| Data Analysis and Showback | Anomaly data must be analyzed and shown as an anomaly for the stakeholders | Identification of the anomaly | None |
| Managing Shared Cost | If an anomaly happen on Shared Costs, the cost of this anomaly should be assigned to the team responsible for the anomaly | Assign the anomaly cost to a cost center (unit, department, team, product, etc) | None |
| Data ingestion & Normalization | Anomaly information should be ingested into the selected tool for analysis and showback | Identification of the anomaly | None |
| Measuring Unit Cost | When calculating the Unit Cost, it should include Anomalies | Cost of anomaly(ies) impacting the unit cost | None |
| Forecasting | Some events (e.g. holiday sales) increase the consumption of cloud resources which might look like a cost anomaly, and anomalies that occurred may need to be filtered out of historical data when update future forecast values. | None | Forecast of any predicted growth or event that might look as a cost anomaly |
| Budget Management | Unusual number of anomalies might disrupt the planned budget | Number of anomalies, size of large anomalies, and cost of the anomalies relative to your budget size. | None |
| Establishing a FinOps Decision & Accountability Structure | It’s important to define the workflows and responsibilities for managing anomalies | Process ownership; responsible to detect anomaly | Act on Anomalies, and implement systems to prevent those to happen |
| Managing Commitment Based Discounts | Expired commitments can generate a spike in costs which would generate an anomaly alert. Although one should be careful not to mistake an anomaly as normal usage when considering purchases. | Inform when there is a spike in costs due to expired commitments | None |
| Onboarding Workloads | A new application/workload might have specific behavior that could cause false alarms | None | Notify for a new workload that might look as a cost anomaly; Provide information on how to detect and prevent false positives |
| Resource Utilization & Efficiency | Certain resources have a dynamic cost, which could lead to anomalies, or false alerts | Alert Engineers about anomalies detected in their workload | Advise FinOps Practitioners about patterns that might look like anomalies |
| Workload Management & Automation | Automation can produce anomalies if there is any misconfiguration or no limits; sometimes automation might increase the capacity that might generate a false alert. | Alert Engineers about anomalies that were caused by automation | Advise FinOps Practitioners about patterns that might look like anomalies |
| Establishing FinOps Culture | As a transversal capability, all Cloud stakeholders should be aware of Anomalies | Best practices shared with stakeholders | None |
| Chargeback & IT Finance Integration | As with any cost in cloud, anomalies also need to be part of charge back | Assign the anomaly cost to a cost center (unit, department, team, product, etc) | None |
| FinOps Education & Enablement | As a transversal capability, all Cloud stakeholders should be aware of Anomalies | Best practices shared with stakeholders | None |
| Cloud Policy & Governance | Policies can be added to prevent anomalies (e.g. policies preventing unnecessary/unauthorized resources) | Policies to prevent launch of expensive services or that can detect and isolate some behaviors (e.g. policies preventing unnecessary/unauthorized resources) | None |
Engineering (DevOps and Observability) intersection
While not a FinOps Capability, it’s good to understand inputs and outputs related to DevOps and Observability functions at an organization. It’s fair to say that anomalies typically happen after some change, which can be on the Cloud infrastructure, software/application, or external circumstances (e.g. more client requests).
When we start the analysis from the cost increase up to the root cause, it can be considered reverse engineering (understanding what changed in the environment that caused the anomaly).
Many companies use systems like DevOps to push changes to the infrastructure or the application; DevOps as a system allow faster changes on the environment, and typically have a CI/CD (Continuous Integration, Continuous Deployment) tool that enable traceability on the changes done (what, when, who), this traceability must be used to reach the root cause faster and also allow to revert the change.
Another key pillar of DevOps (and engineering best practice) is to have Observability over Cloud resources, this allows to capture a set of metrics from the running infrastructure and application; Those metrics in isolation allow to manually investigate why a certain resources utilization have increased (e.g. higher number of client requests caused a spike in database IO or network traffic).
When overlapping both operational metrics from Observability with Cost Metrics, the engineers and FinOps practitioners can easily detect abnormal cost behaviors based on operational behaviors, or easily dismiss a false positive.
For example, if the utilization of the platform is growing and there is a dynamic part of the system that scales, it’s important to dismiss alarms for the dynamic part (e.g. Spot resource group, network traffic), while if in the same system the stable part has any consumption growth, then there is a need to investigate and, if required, take action to remediate.
Get involved
Our community welcomes feedback and recommendations on improving the content in this documentation. You can get in touch in our Slack channel, #chat-anomalies, to discuss any of the content here or to pitch new content if you’re interested in being a part of a future sprint.
Cloud cost anomaly management is a part of a larger FinOps curriculum which we encourage practitioners to learn more about. If this education and training is something you or your teammates require, consider our FinOps Certified Professional course.
If you are reading this and aren’t a part of the FinOps Foundation community yet, we welcome you to sign up and join us.
Acknowledgments
The FinOps Foundation extends a huge thank you to the members of this Working Group that broke ground on this documentation:

Angel Alves
Saint-Gobain
Keith Knowles
Envisor
Sounthar Manickavasagam
HERE Technologies
Victoria Levy
Alteryx
Yogendra Joshi
Google
Usha Ganesh
Electronic Arts
Mala Vengatesan
Symetra
Ira Cohen
Anodot
Sivaprakash Durairaj
Lenovo
Pathik Sharma
GoogleThanks to these supporting contributors as well:
- Hanif Ali
- Vijay Mullangi
- Vijay Kudithipudi