Unit Economics in the Public Sector
Introduction
Unit Economics help organizations evaluate the effectiveness of cloud use. The FinOps Foundation describes the Unit Economics capability in the FinOps Framework as follows:
Unit Economics bridges the gap between what an organization spends on cloud and the fundamental value that cloud spending creates…These unit economics should inform the behavior of engineering teams to work on incremental development on elements that are responsible for generating unneeded cost or that create excessive value.
Unit Economics seek to express the fundamental business value created by a set of cloud investments as a metric that can be understood and acted upon by cloud operators and business leaders. Public sector organizations can redefine “business value” as “mission value”.
The question becomes, how can the public sector maximize its mission value while minimizing the cloud cost of doing business? If properly defined and measured, public sector unit economics can clearly show this relationship between a unit of service delivered and the cloud cost to provide that service.
Unit Economics can be expressed in non-financial value terms, such as cost per click, cost per customer, cost per hosted site, etc. But perhaps more often they are expressed in financial value terms, comparing cost to sales, revenue, or profit.
The public sector does not typically have profit or revenue, and therefore must focus on incentive drivers in the performance of its missions and delivery of its services rather than increase revenue and profit. Public sector organizations seek to maximize service delivery and avoid unnecessary cost. In this context, the goal of implementing unit economics in the public sector should be to define clear mission or service delivery metrics and tie them to costs.
The benefits of adopting unit economics can differ as well. By focusing on units that aren’t revenue-based, the conversation can shift to obtaining stakeholder buy-in, measuring efficiencies not just technically, but financially, or assisting in defending planned expenditures during budget exercises. It is important to note that in the public sector, budgets may not be spending guidelines that can be exceeded when necessary, but rather statutory limits which cannot be exceeded without very specific processes or authorities well beyond the FinOps team.
Unit economics can be used to measure both resource efficiency and mission outcomes.
Resource efficiency metrics are similar for both private and public sector organizations (e.g. average unit cost of a GB of storage).
Due to the dynamic nature of cloud costs, the government needs a way to measure its efficient use of cloud resources and demonstrate proper stewardship of funding.
Outcomes of Implementing Unit Economics in the Public Sector
One of the outcomes of employing public sector unit economics, beyond maximizing service delivery and cost avoidance, should be to provide transparency and understand how funds are expended in the delivery of a public sector service. Thus, beyond merely focusing on cost avoidance, the unit economics metrics can demonstrate the efficiency of the service being delivered. When paired with overall service delivery metrics, the unit economic metrics will also show how efficient the service provider is at delivering a service.
Public sector value delivery extends beyond financial metrics, emphasizing operational efficiency, improved service delivery, and increased agility in responding to citizen needs. This not-for-profit-oriented approach to unit economics enables optimized resource allocation, streamlined processes, and enhanced public services while maintaining fiscal responsibility.
This can be of great benefit to both the servicing agency and the customer. The servicing agency can take these metrics, implement measures to improve them, and watch trends over time to see if the measures are providing the expected outcomes. Customers can also see how the public sector is delivering on commitments to provide higher quality services more efficiently. Budgeting authorities can also use unit metrics to clearly communicate their expectations about the impact of budgeted funds by budgeting “$/outcome x expected outcomes” in a way that makes it clear when budgets are at risk whether the issue is inefficiency in delivering the service, incorrect assumptions about the cost of delivering the service, or incorrect assumptions about how many of the service would be used/consumed.
Unit Economics Use Cases in the Public Sector
When employing the unit economics concept, one can consider varying levels of metrics. The figure below displays how the unit economic levels can build on each other. Metrics can measure efficiency from the cloud resource (system) context up to the mission / service (business) context and typically would first be implemented at the lower layers of the pyramid before progressing to the upper layers. Consider the crawl-walk-run levels of the larger FinOps Framework. The same can be applied here, most will start their journey at the bottom of the pyramid and reach a run phase at the top.
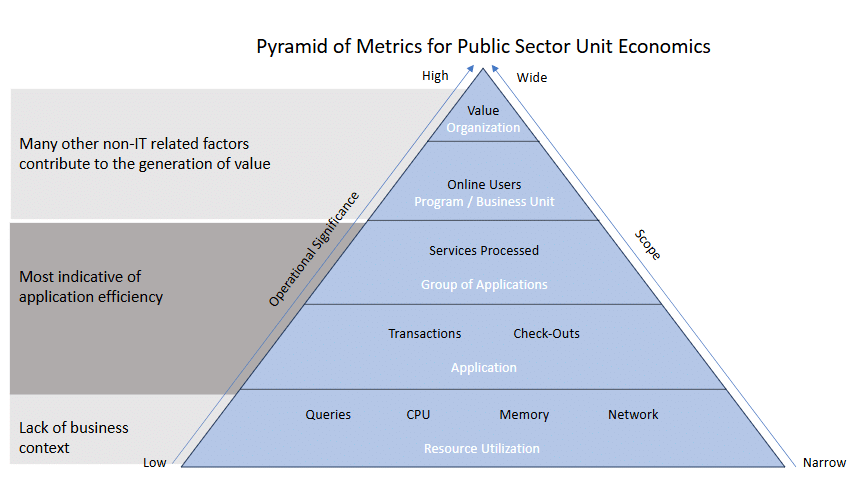
For example, a foundational unit economic metric could be VM-attached storage in GiB/hour (Gigabytes per hour). This would allow the trend analysis to be completed showing how a potential reduction in attached storage, and the associated cost avoidance, could occur over time. In parallel, system performance can be measured, to monitor if the reduction in attached storage affects system performance. The goal would be to reduce storage to a level that avoids costs without impacting performance. This could also be used to inform standard configurations for new workloads based on this quantifiable data.
At the higher levels of the pyramid, a metric such as “cost per customer served” would allow a trend analysis to be completed. For example, cloud costs could increase, but the unit economic metric will indicate if this is related to increased mission value delivery (e.g., increased customers) or cost inefficiencies (e.g., over-provisioned compute resources) in the cloud infrastructure.
Some examples of public sector unit economics measurements include:
- Cost of Organization per unit processed.This is indicative of your fully loaded costs (total cost of ownership) per unit serviced, providing overall mission or business value metrics.
- Total cost of all materials recycled by the community recycling administration (including technology, human capital, etc) divided by pounds of materials recycled equals the total cost of materials recycled per pound.
- Cost of a mission or program per unit processed. This is indicative of your cost of each specific mission or business function. Could include fully loaded costs or just costs related to the cloud or technology you want to measure.
- Total cost of the licensing service program divided by total number of licenses issued equals cost per license issued.
- Total cost of search and rescue missions performed divided by number of lives saved equals cost per life saved.
- Cost of a service per unit processed. This is indicative of application efficiency.
- Total cost of the voter registration services (comprised of a group of applications) divided by the total number of voters registered equals cost of registration service per voter registered.
- Cost of transactions per application. This is indicative of application efficiency.
- Total cost of the transactions processed by the voter verification module used by the voter registration application divided by number of voter verification requests made equals the cost of verification transactions per voter verification request.
- Cost of cloud resource per system.This raw cost data without business context forms the building blocks of cost data.
- Total cost of compute resources per system divided by the number of systems equals the average cost of computer resources per system.
- Total cost of all queries to the database divided by the total number of queries equals the cost per each query to the database.
- Total cost of memory for a system divided by total number of virtual machines equals the cost of memory per unit (GB RAM) utilized per virtual machine.
Specific Unit Economics Use Cases
Below are a few examples of resource efficiency and mission-focused unit economics. Resource efficiency metrics are essentially the same for both private and public sector we will focus on mission-outcome unit economics and metrics.
Mission-focused unit economics in the public sector could be divided into five broad categories:
Monetary-Based outcomes: The government provides a financial benefit to a group of citizens based on their legal eligibility. For example, Veterans may receive educational funds if their enlistment contract so stated (total cost per $1 million in education benefits granted).
Service-Based outcomes: The government provides a non-monetary value to a citizen. For example, disaster victims may receive counseling services (total cost per 100 hours of Post Traumatic Stress Disorder (PTSD) counseling).
Defense-Based outcomes: One of the primary functions of governments is to protect its citizens. The protection from threats is perhaps the most difficult to quantify, but an example may be the operation of missile test range management (cost of missile range cloud infrastructure per satellite missile launch).
Infrastructure-based outcomes: The government provides public infrastructure to support commerce, travel, shelter, and energy among others. An example is ensuring safe and serviceable runways (cost of autonomous runway inspection drones per 1000 feet of airport runway inspected).
Research-based outcomes: The government invests in research to provide answers to some of the most challenging questions. The benefit of this research often accrues to citizens. As an example, facilitation of the development of the COVID vaccine, helped save millions of lives (cost of research machine learning and vaccine modeling per person vaccinated).
Conclusion
While public institutions are more limited in their use of unit economics, there are still a wide variety of ways to use them to drive outcomes that are beneficial to the agency or program team managing cloud spend, and valuable to budgeting authorities when setting budgets.
Private organizations can also use these same techniques to express non-financial value.
Appendix
Service-based outcomes / A VA unit economics use case
One example of service-based outcomes would be benefits delivered by the VA to Veterans such as VA Loans – the below graphic shows notional cloud costs broken down over the product value stream that delivers the VA Loan management software (completely notional). We compare the value of the loan benefits delivered over a period of time and divide cloud related costs into that amount to get a percentage – in this case 10%. So now if demand for VA loans increases, cloud costs can be related proportionally to this rise in demand.
Potentially simpler method with the same use case would be to measure cloud-related costs per VA loan finalized per time period (month, quarter, etc.)
Department of Homeland Security / FEMA Unit Economics use case
At a DHS component, unit economics is used to measure and track spend and support towards various short-term emergency-event-driven projects that are key to the component’s mission. Since funding is allocated to the central component OCIO as well as emergency event field offices, it is crucial for the component to understand when and how cloud resources are being applied towards the mission, and whether it’s supporting emergency response in a direct or indirect capacity.
Since the same cloud resource SKUs are used for OCIO / central functions in addition to emergency event field offices, the cost per resource consumed is crucial, and the units tracked to measure value differ depending on if the compute is applied towards a central function or a project. Using metrics like those listed below, the DHS component is able to track performance of OCIO systems as well as efficiency of joint field office operations.
Examples of different service-based units of measure used by this DHS component are listed below:
In support of OCIO functions:
- Spend per HQ system supported
- Spend per HQ employee & contractor supported
- Period-over-period increase in spend per HQ FTE
- Period-over-period increase in spend per system supported
- Period-over-period increase in system-specific spend
In support of emergency event joint field offices (JFO):
- Monthly Spend per JFO system supported
- Monthly Spend per JFO deployed personnel
- Monthly Spend per JFO civilian supported
- To-Date Spend per JFO system supported
- To-Date Spend per JFO deployed personnel
- To-Date Spend per JFO civilian supported
Department of Defense unit economics use case
At a Department of Defense agency, unit economics is used as a supporting metric to see how projects perform or as a way to measure ROI. For example:
When first moving to the cloud initially, many of the migrations were manual and lift and shift. Additionally, due to the ATO process & cyber security requirements to maintain secure systems, many virtual machines were stood up and required many steps to be compliant. These machines would be left running while going through multiple cyber checks and while awaiting ATO. Over time, automation became an initiative to drive efficiency, reduce errors, and reduce cost.
One of the ways this agency measured how automation and Infrastructure as code assisted not only in efficiency but also in saving money was through measuring the cost of spinning up a resource manually versus via Infrastructure as Code (IaC).
In order to determine cost the following information was gathered:
- Cost of compute sitting idle awaiting ATO (per hour)
- Time each virtual machine took to be created manually
- Time each virtual machine took to be created via IaC
Using this information, we calculated the cost per compute sitting idle awaiting complete configuration and cost per compute sitting idle awaiting ATO.
The following numbers are representational of the use case above and for example purposes only.
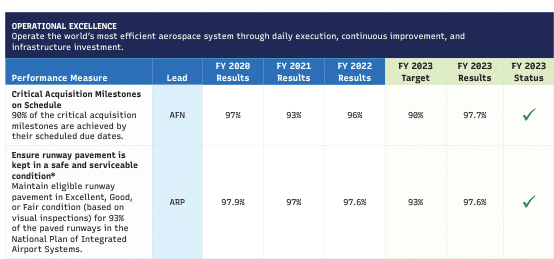
Infrastructure-based outcomes a FAA unit economics use case
In the case of The Federal Aviation Agency (FAA), ensuring safe and serviceable runways is an example of an infrastructure-based outcome. We could then identify the direct cloud costs per runway maintained. This might include all cloud costs related to:
- A runway operational maintenance application
- A database for airfield and runway dimensional metrics
- A runway development and sustainment cost planning tool
- A customer-facing emergency call center application.
These cloud costs would be entered into the Unit Economic Calculator cloud cost section (see Appendix X). The fully loaded costs of providing safe and serviceable runways, including SaaS, Marketplace tools, and personnel managing cloud support operations, a cloud center of excellence, professional services, etc. can be entered into the total cost section of the calculator.
The resulting unit economic might look like $100K per year in cloud-related costs required for the support applications to ensure the physical logistics and maintenance of one runway ranging in size from 8,000-13,000 ft. long (A typical commercial airline runway in the US is between 8,000–13,000 ft (2,438–3,962 m)) (Source: Stantec: How Long Is an Airport Runway?).
The unit economic metric would be cloud cost per runway maintained and we would hope to reduce that metric over time to offset increases in physical materials and labor. The value of FinOps and Cloud use would be magnified against the backdrop of overall rising maintenance costs.
Another approach in this use case could be determining the annual maintenance costs for a runway in the above ranges and dividing the cloud costs for project management, procurement, compute, data/document storage, etc., by the overall maintenance costs. In this case, the unit economic metric would be associated cloud costs/total maintenance costs = $100,000/$40,000,000 (est. annual maint. Costs = ~$5K per meter * 8000 meters – see above) = .0025. This metric could then be compared for different airports in different climates or higher cloud engineer labor rates, etc., to begin to analyze variances for potential improvement – sharing lessons learned across airports or regions.
Source: Flying Magazine: America’s Longest Runways
If there were significant differences between runway logistics and maintenance, the unit economics could be computed by individual runways and averaged.
Source: FAA.gov: 2023 Performance and Accountability Report.
Acknowledgments
We’d like to thank the following people for their work on this Paper: