FinOps for Azure Managed Disks: Optimizing for Value
Azure Managed Disks are a fundamental component of the Azure cloud computing platform, offering persistent, secured block storage for Azure Virtual Machines (VMs). They are essentially virtualized physical Disks, where Azure takes on the responsibility of managing the underlying storage.
About This Paper
This paper provides guidance on the usage, optimization, and performance of Azure Managed Disks (hereafter referred to as Disk or Disks). It outlines key steps to understand the pricing model, the relationship between price and performance, and how to identify waste. While the primary focus is on Azure Managed Disks — including Standard, Premium, and Premium V2 tiers — the concepts discussed are equally applicable to AWS EBS volumes.
Who Should Read This Paper
The paper will guide the FinOps Practitioner to understand Disk spend in relation to performance, help them identify areas of waste, and understand how to maximize value through reducing waste and choosing the most appropriate type of managed Disk for each workload.
Prerequisites
- Basic understanding of Azure Managed Disks and operations
- Access to Cost and Usage reports
- Access to the Azure Portal and Azure Monitor Metrics
- Access to Azure Log Analytics or other existing observability tools
- Excel, PowerBI, or any other reporting tool of choice
Analyze Disk Costs within the Storage Environment
As shown in the sample table below, this analysis helps place a dollar value on storage and provide visibility on what products the FinOps Practitioner should focus on. This storage spend analysis allows the FinOps Practitioner to communicate the size of the opportunity to senior management and technical teams. The analysis can be conducted via the Cost Analysis tool within the Azure portal, setting the required filters and date range as needed.
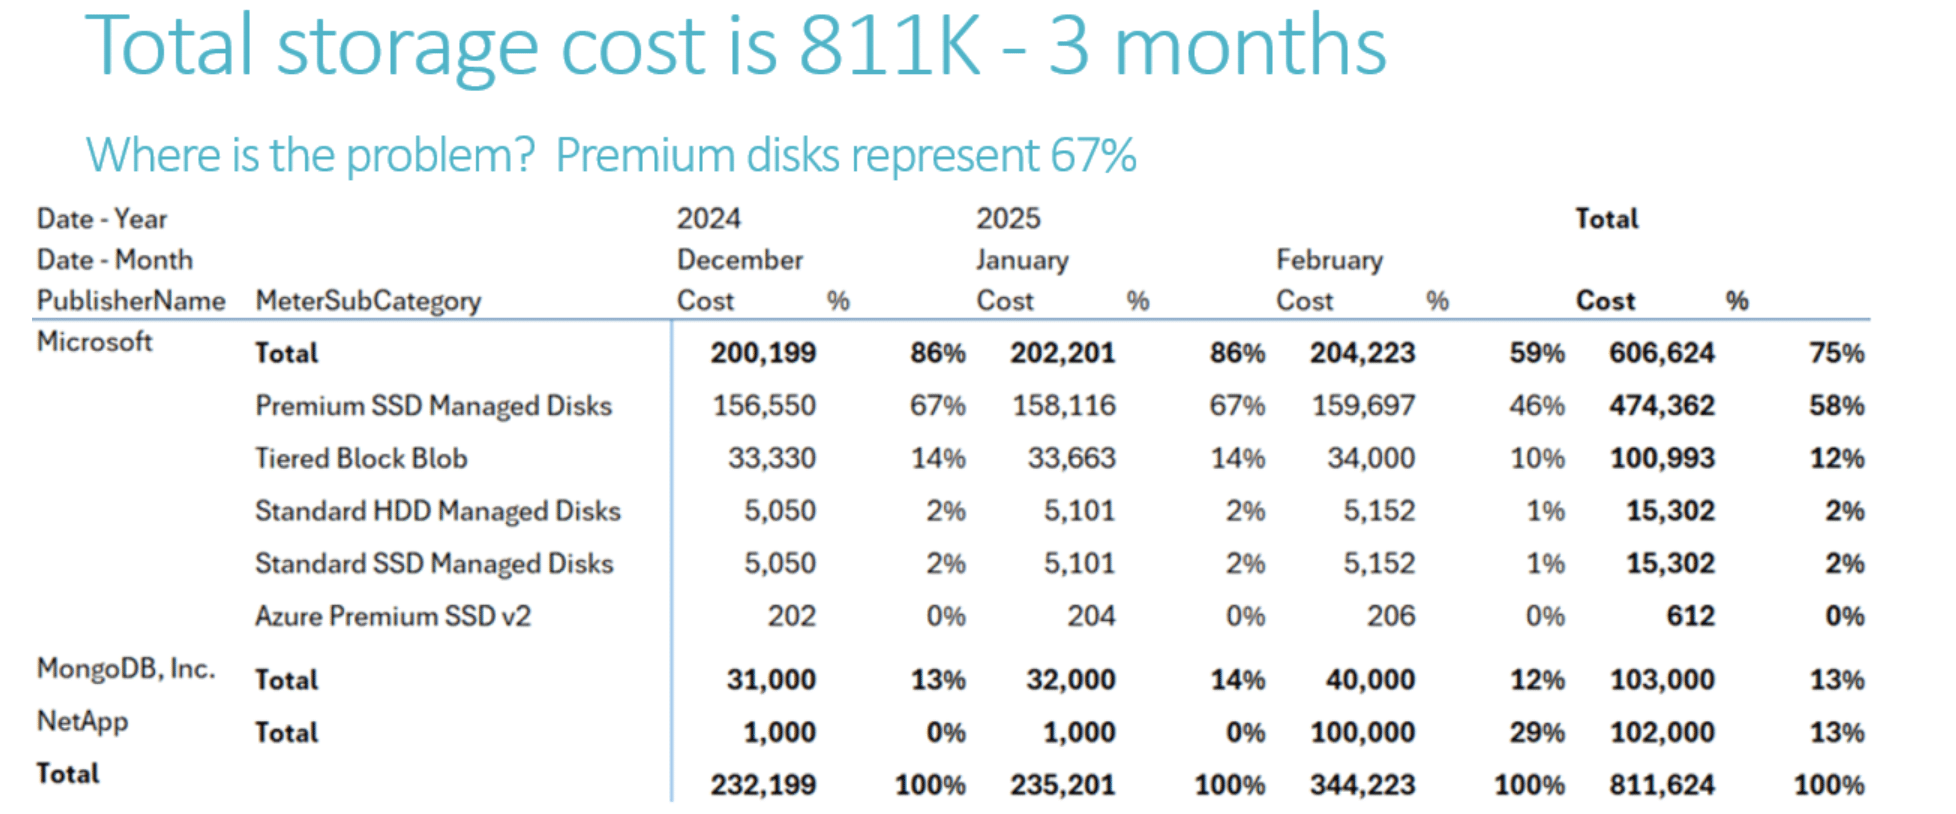
This sample table shows an example of storage spend analysis.
Quantify Types of Storage Waste
In this section, we examine two key approaches to identifying storage waste that support storage optimization:
- A. Used vs. Available Disk Space and
- B. Provisioned vs. Utilized IOPS
Used vs. Available Disk Space
Analyzing free Disk space is a useful indicator for identifying potential storage waste. This data can be sourced from Azure Log Analytics or from observability tools commonly managed by Site Reliability Engineering (SRE) teams. To ensure meaningful insights, it is recommended to calculate free space as an average over a representative period (e.g., three months), rather than relying on a single point-in-time measurement.
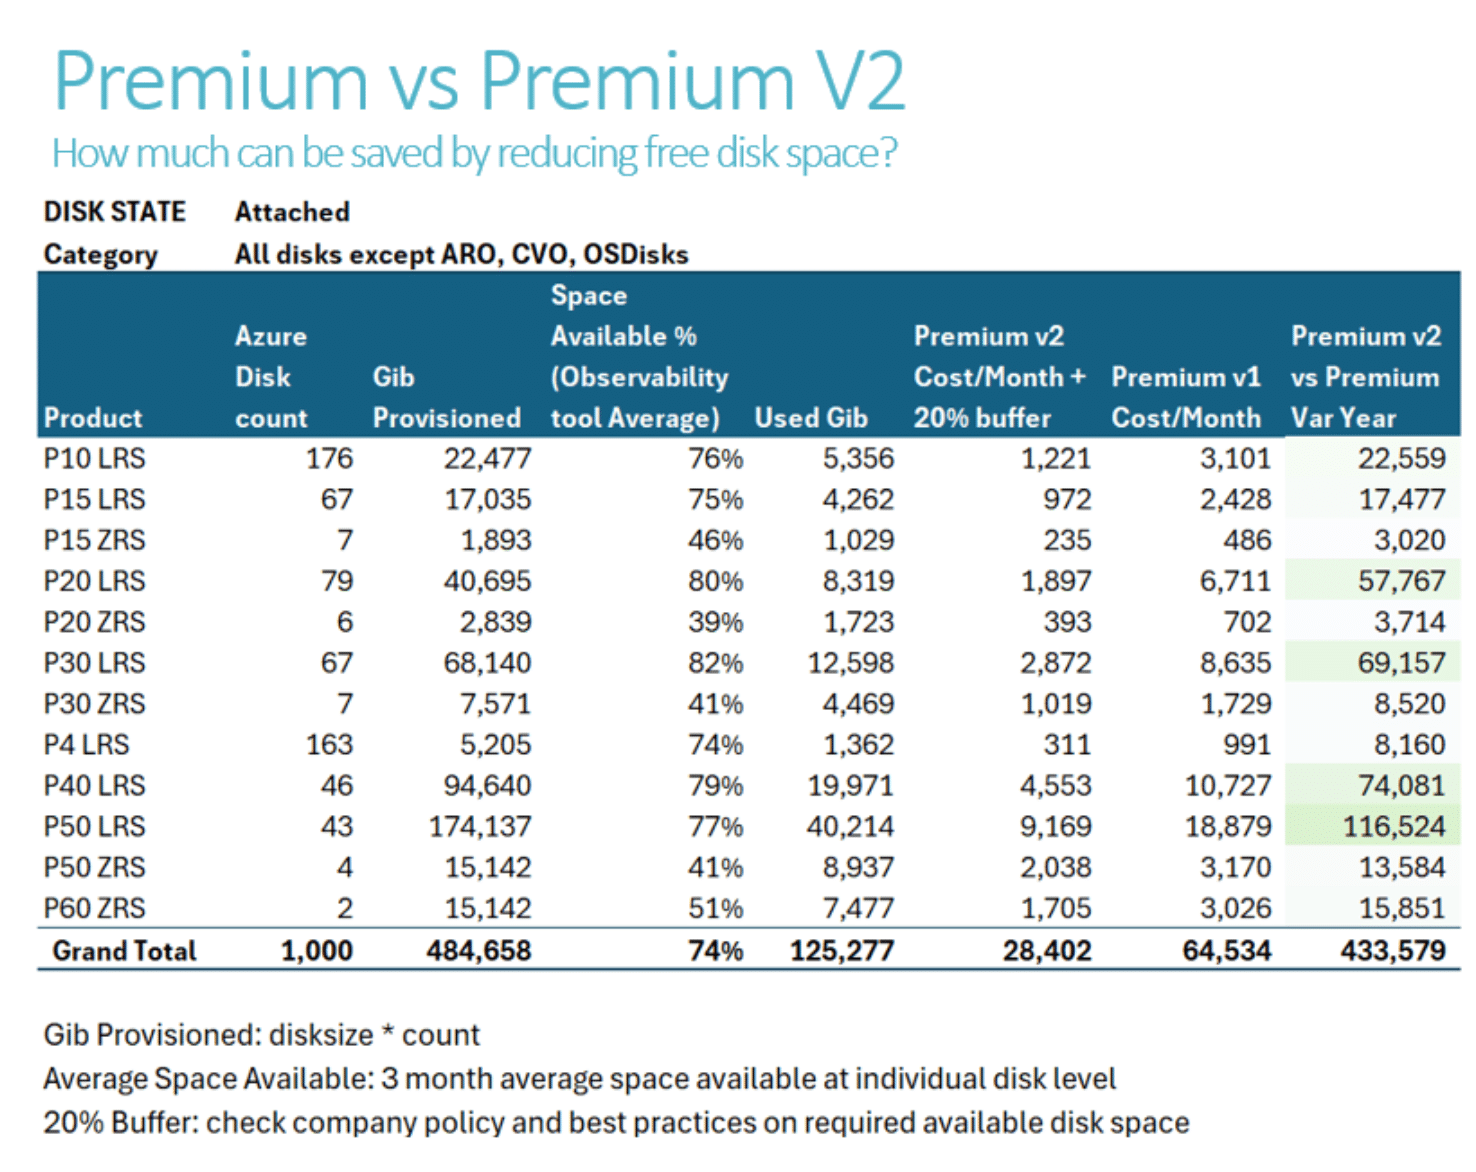
The sample table below highlights a significant amount of free space across several Azure Managed Disk configurations, such as P20 LRS and P30 LRS. While maintaining some free space is necessary for reliability, excessive free space may indicate waste — and with it, opportunities for optimization. Notably, certain Disk types support configurations that allow for a closer alignment between used and provisioned capacity. We will explore these options later in the paper.
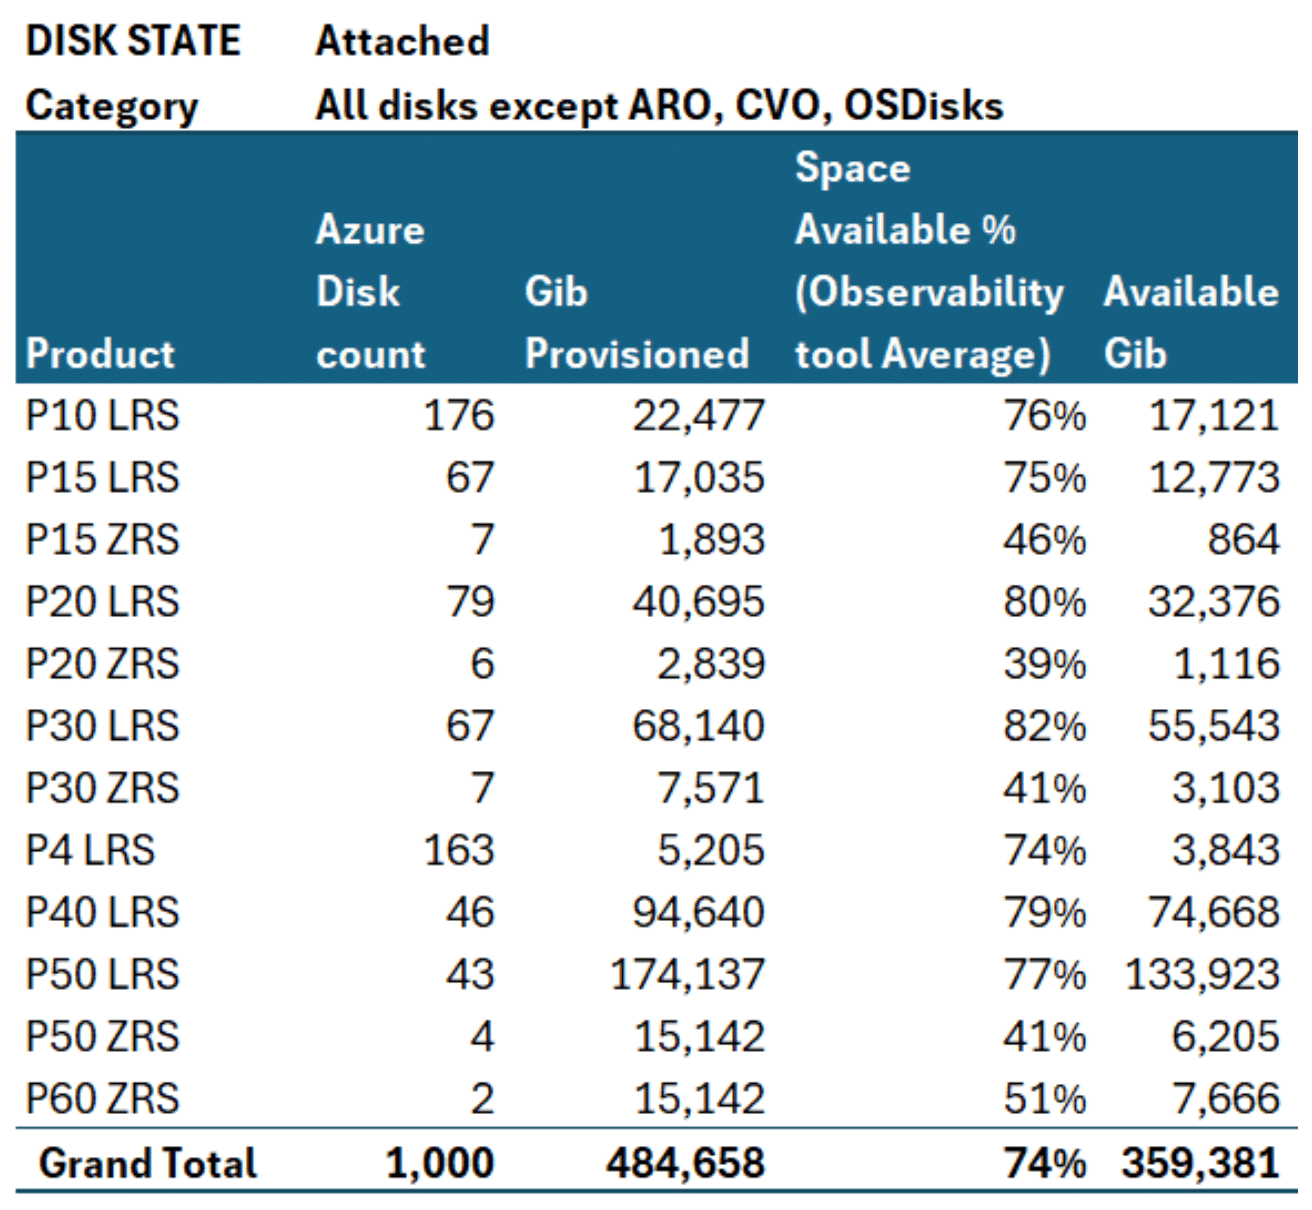
This sample table highlights free space across several Azure Managed Disk configurations such as P20 LRS and P30 LRS.
Provisioned vs. Utilized IOPS
Another approach to identifying storage waste is to find underutilized Disks. While Disks are generally priced based on provisioned capacity (per GiB), performance characteristics — such as IOPS (Input/Output Operations Per Second) — also significantly influence cost. IOPS is a key metric that reflects a Disk’s speed and responsiveness. For instance, Premium Disks cost more than Standard Disks of the same size due to their superior performance capabilities. Identifying Disks that are over-provisioned in both capacity and performance can reveal further optimization opportunities.
High-IOPS (Input/Output Operations Per Second) disks typically come at a higher cost. The analysis below highlights the gap between provisioned (i.e., paid-for) IOPS and actual utilized IOPS, revealing potential underutilization. Disks with consistently low IOPS usage relative to their provisioned capacity may be good candidates for downsizing to lower-performance, lower-cost options. This analysis is based on a three-month average of utilized IOPS to account for workload seasonality and fluctuations.
While average IOPS is useful, peak IOPS can also be relevant. However, peaks should be evaluated carefully to determine whether the performance premium is justified. For example, if a Disk experiences IOPS spikes during backup operations, it’s worth considering whether provisioning for high IOPS is necessary to maintain fast backup execution, or if a slightly longer backup window (e.g., five extra minutes) could offer meaningful cost savings.
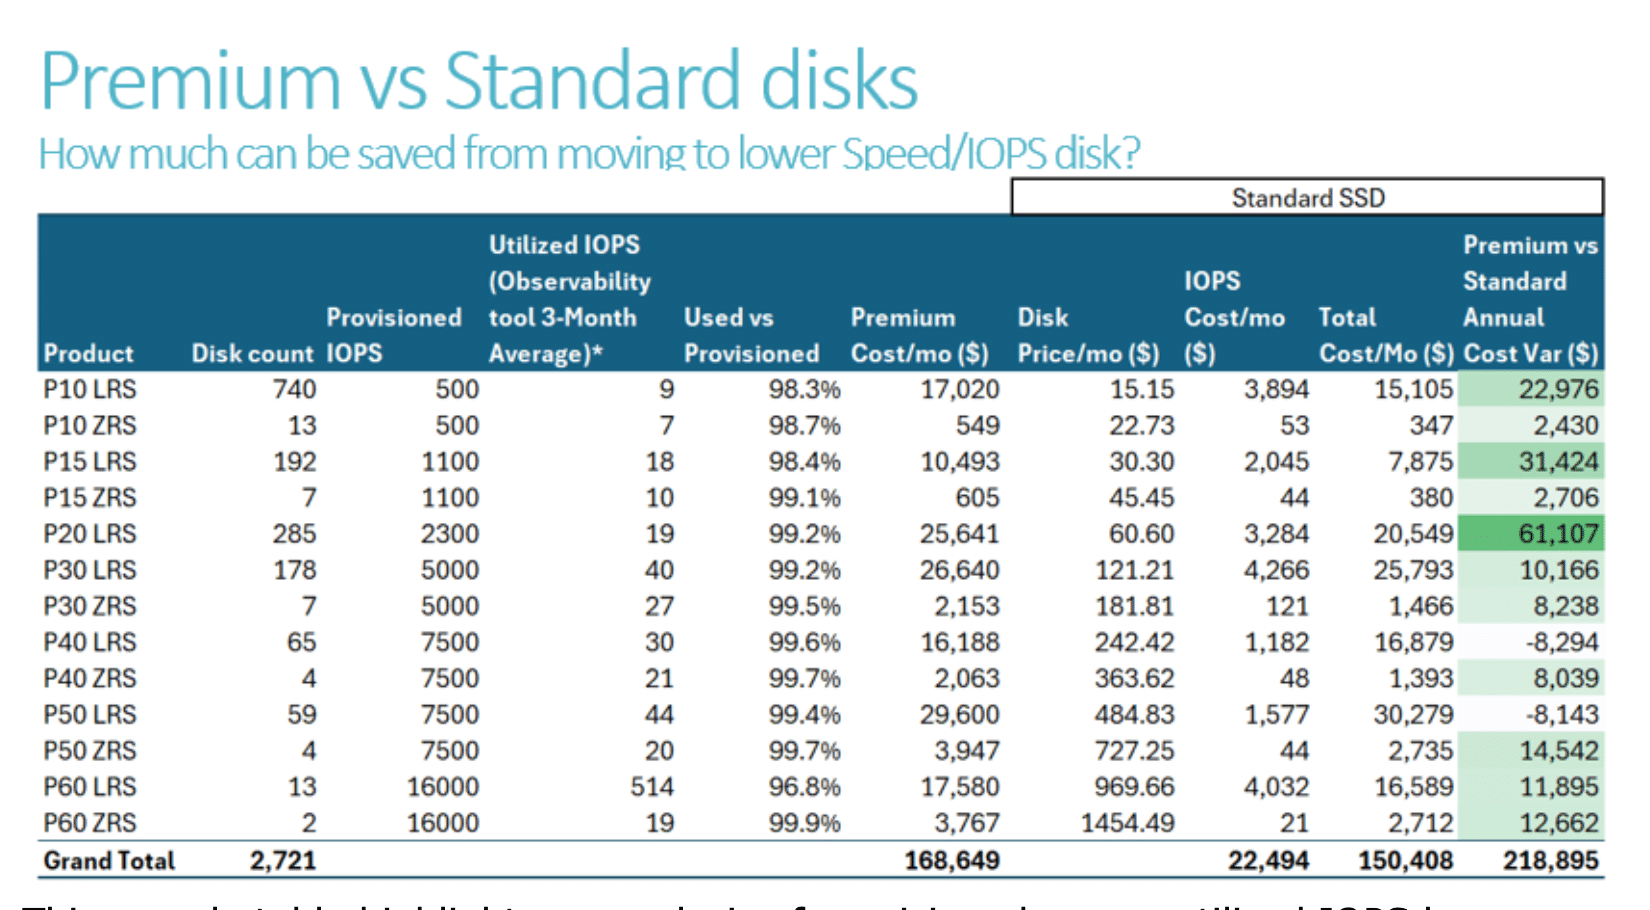
The results shown in the sample table below provide an indication of where to focus analysis and optimization efforts using the aggregated average value as a rough heuristic. The analysis aggregates the results for each product into a single “utilized IOPS” value (e.g. an average for all P10 LRS Disks). This simplification means that the results may not be accurate, on a per-Disk basis, but they offer a general measure for optimization potential. Returning to the P10 LRS Disks, the large number of Disks and low average utilization vs. provisioned IOPS indicate optimization potential.
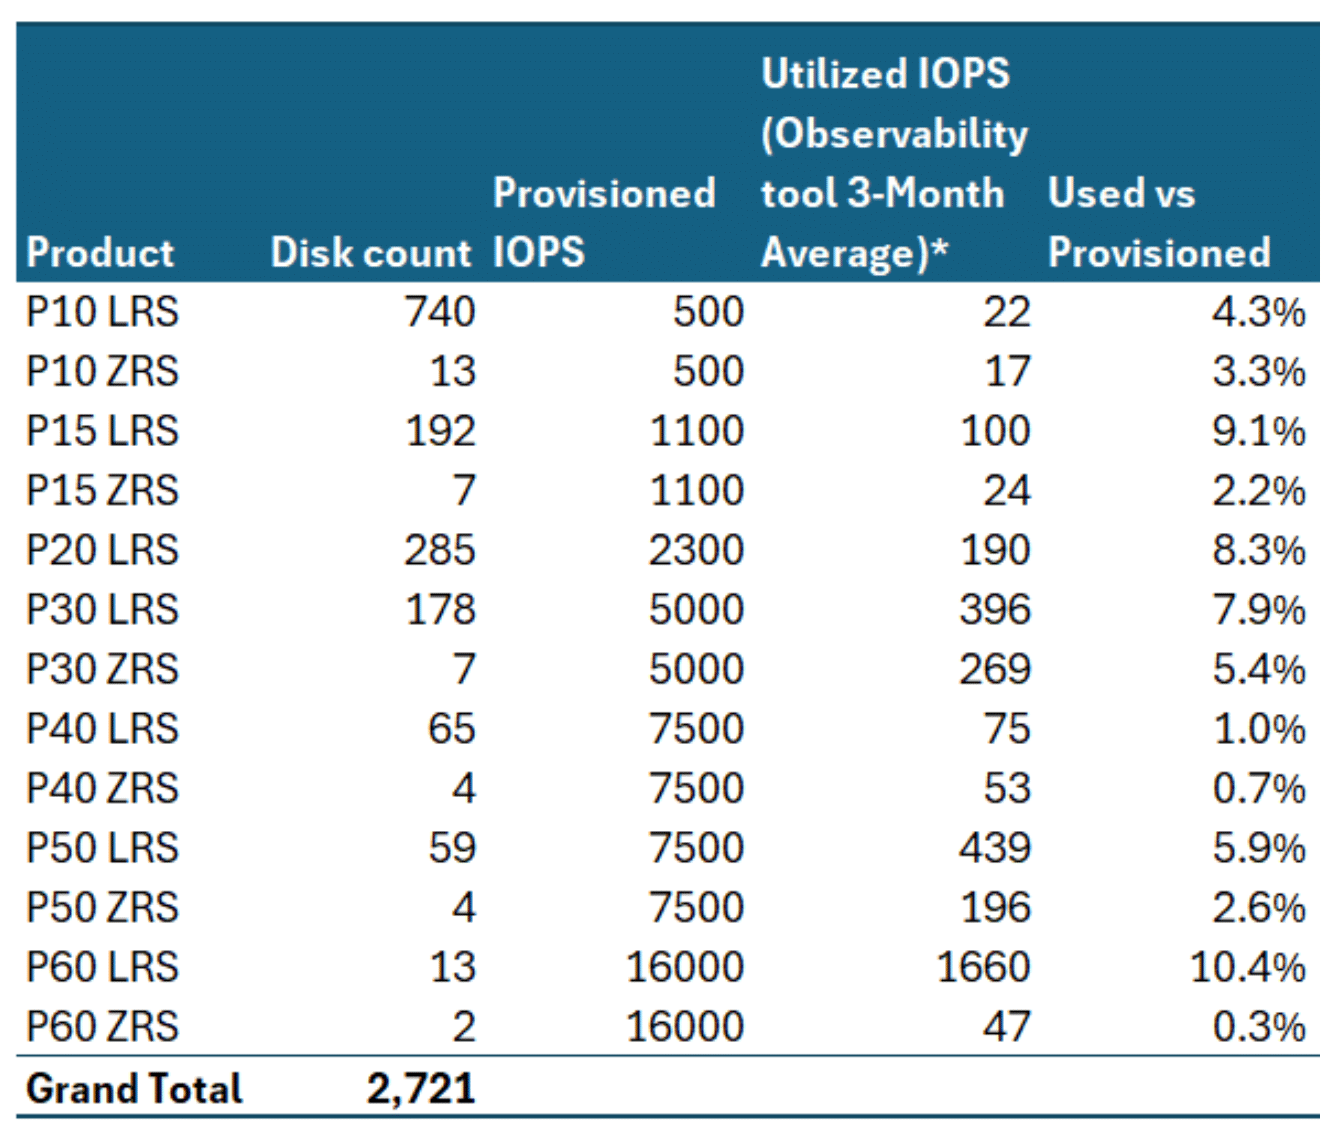
This sample table shows average IOPS used; also consider the Max IOPS. This is the average of multiple Disks, some Disks might have higher IOPS than average.
Optimizing for Value
The previous section identified two primary forms of storage waste: excess free disk space and underutilized disk IOPS. In this section, we explore the available options to address these inefficiencies and examine the potential cost savings associated with each.
One way to reduce waste from free disk space is by resizing Disks to a smaller capacity, which directly lowers cost. There are several approaches to achieve this. One option is to retain the same Disk type but downsize — for example, reducing a Premium P30 (1 TB) to a Premium P20 (512 GiB). Alternatively, the Disk can be migrated to a different storage tier, such as Premium V2, which offers distinct advantages and limitations outlined below.
Premium V2 offers several advantages and is considered a viable alternative to Premium Disks in the sample chart below. The first key benefit is a lower cost per GiB of capacity compared to Premium Disks. The second is greater sizing flexibility. While Premium Disks are billed per Disk per month and are only available in fixed sizes (e.g., 512 GiB, 1 TB, 2 TB), Premium V2 Disks are billed per GiB per month and can be provisioned in more granular sizes — such as 350 GiB or 1.2 TB.
In addition to size flexibility, IOPS can also be provisioned independently in Premium V2. For example, a Disk with a relatively small capacity can still be configured with high IOPS — unlike Premium Disks, where higher IOPS are only available with larger capacities.
However, Premium V2 Disks also have limitations that may restrict their applicability. They are not yet available in all regions, cannot be used as OS Disks, and are only supported for VMs in zonal scale sets, not regional ones. When deploying a VM or a VM scale set using Premium SSD v2 disks, the deployment must occur in a region with Availability Zones, and the scale set VMs must be explicitly tied to a zone during creation. For a complete and up-to-date list of limitations, please refer to the References section at the end of this paper.
The chart below compares various Premium SSD v2 IOPS provisioning options against a benchmark Premium (v1) Disk. The benchmark in this case is the P30, which offers 1 TB of storage, 5,000 IOPS, and 200 MB/s throughput. To ensure a consistent comparison, we provision a Premium SSD v2 Disk with the same storage capacity and throughput, while varying the IOPS. As shown in the chart, a Premium SSD v2 Disk with equivalent IOPS delivers an 18% cost savings compared to the P30 — $137 vs. $167. Put differently, for just 4% more than the cost of a P30, it’s possible to provision a Premium SSD v2 Disk with double the IOPS, while maintaining the same storage and throughput levels.
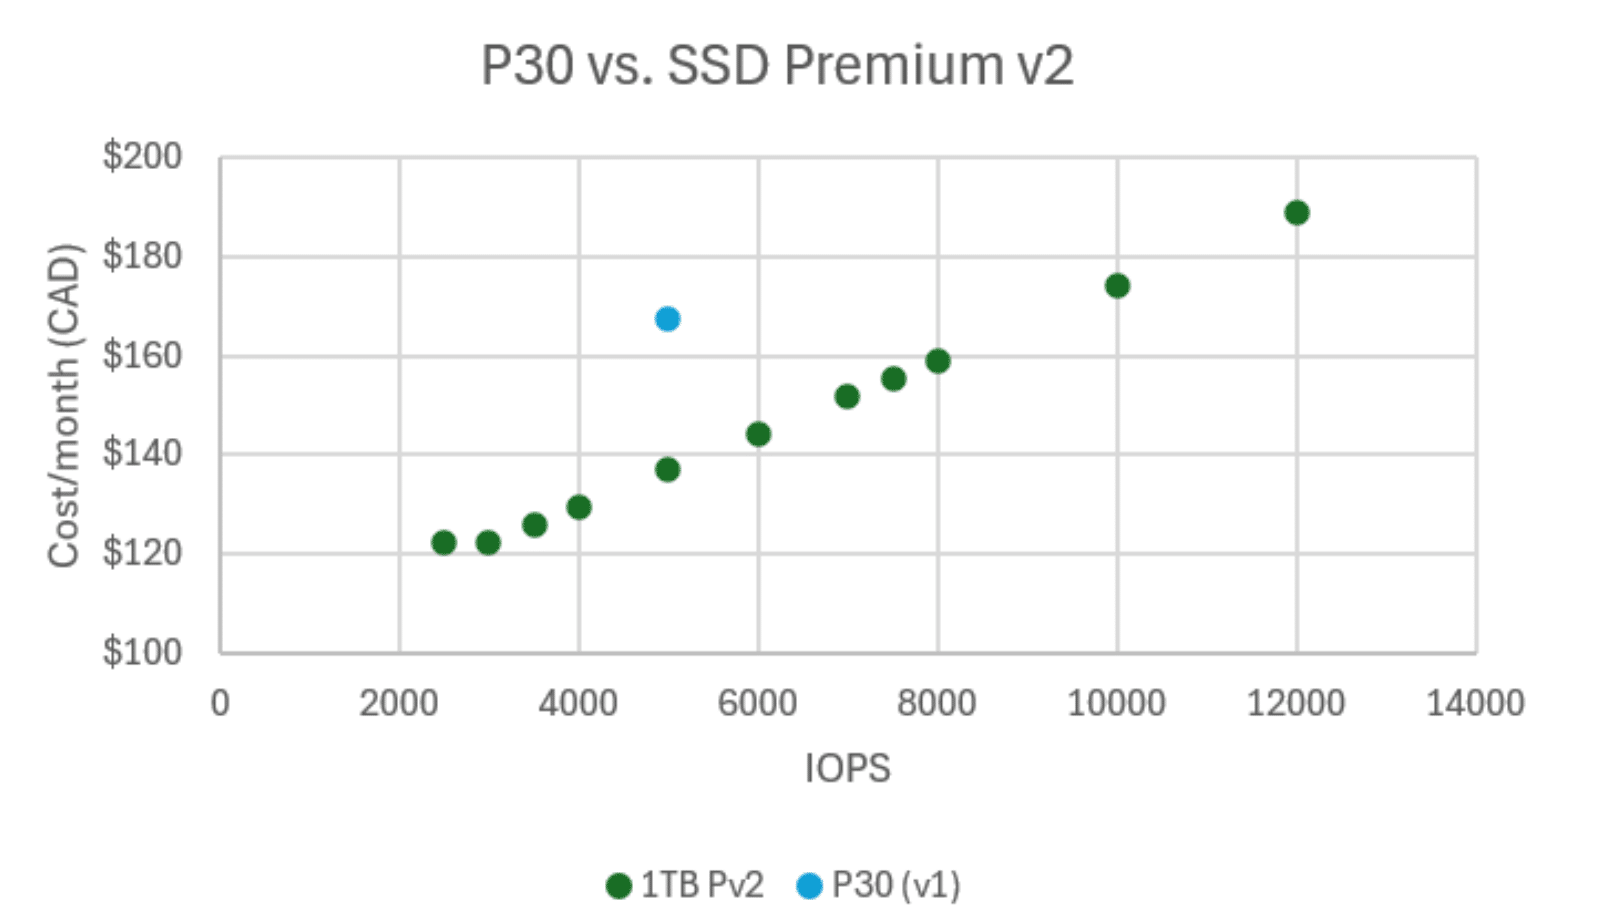
This sample chart compares a range of SSD Premium V2 IOPS provisioning options with a benchmark Premium (V1) Disk.
The chart below presents a similar analysis, this time comparing a range of Premium SSD v2 Disks — each with 2 TB of storage and fixed throughput — against an equivalent Premium P40 Disk. As illustrated, a Premium v2 Disk with matching IOPS is available at a significantly lower cost — $276 vs. $320. Alternatively, for the same cost as a Premium (v1) P40 Disk, one could provision a Premium v2 Disk with nearly double the IOPS — 7,500 vs. 13,500 — while maintaining the same storage and throughput.
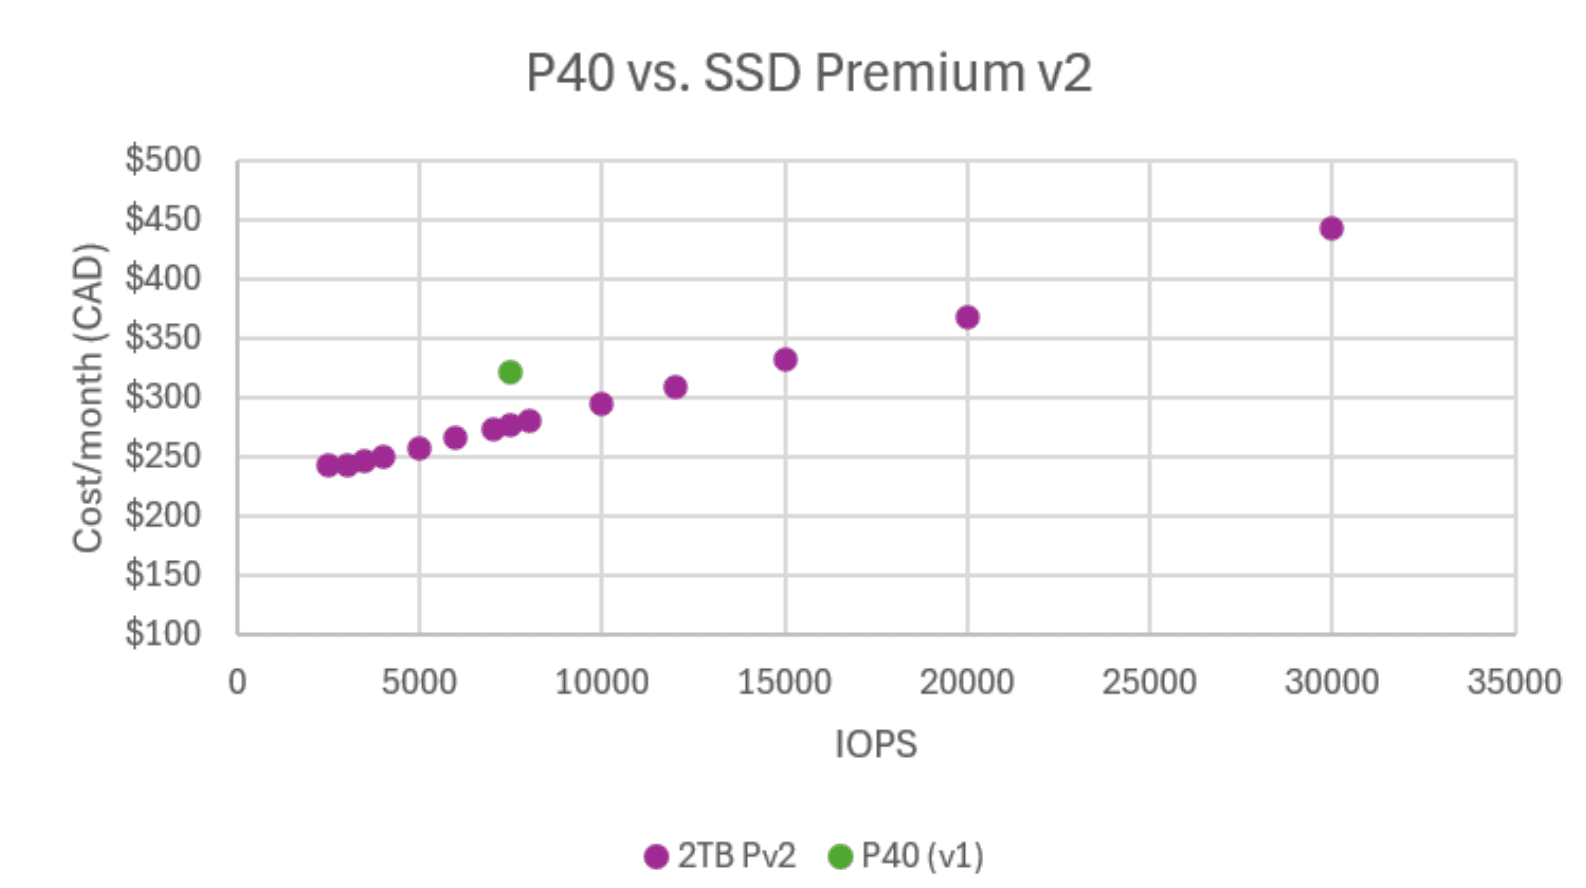
This sample chart compares a range of Premium V2 Disks (with 2TB of storage and fixed throughput) with an equivalent Premium P40 Disk.
Note that the percentage savings difference for the 2TB (P40) scenario is slightly less than in the 1 TB (P30) scenario: for the 1TB Disk, one will save 18% by switching to Premium V2, whereas the difference is only 14% for a 2TB Disk; this trend of diminished savings impact continues for larger provisioned Disks (P50, P60, etc.). This is because the Premium Disks are provisioned with steadily increasing IOPS which, under the Premium V2 pricing model, incurs a linear cost increase ($0.74/100 IOPS per month, for IOPS over a 3,000 baseline). The Premium pricing model, by contrast, increases linearly with the storage size. To sum up, even for the largest Disk sizes, an equivalently-configured Premium V2 Disk will be less expensive than the Premium Disk, but the percentage savings is less dramatic than with the smaller Disk sizes.
A common use case to consider is the deployment of RAID arrays. By design, RAID configurations consist of multiple Disks of the same size, which reflects the “redundant” aspect of the RAID acronym. As a result, disk size flexibility — a key benefit of Premium SSD v2 — is generally less relevant in this context, unless you specifically require non-standard sizing for all disks in the array.
However, Premium v2 Disks may still be attractive due to their lower per-GiB cost and flexible IOPS provisioning, even without the advantage of varied sizing. RAID arrays can be designed to optimize for resilience, performance, or cost-efficiency, which influences factors such as the number of disks, striping strategy, and other architectural decisions. These considerations should be carefully evaluated when selecting disk types and designing storage solutions.
The sample table below places a dollar value on free Disk space. By eliminating free space and leaving a reasonable amount (20% in this example), the saving potential can be quantified.
Additionally, a significant gap between provisioned and utilized IOPS indicates that the current Disk tier may be over-provisioned for the workload. In such cases, switching from a Premium to a Standard Disk can lead to meaningful cost savings. Standard Disks are better suited for low-performance workloads, such as backups or development environments.
The sample table below builds on the earlier analysis of provisioned versus utilized IOPS by illustrating the potential savings from moving to a Standard Disk of the same size. It also accounts for key nuances — such as the IOPS billing model. While Premium Disks include provisioned IOPS at no additional cost, Standard Disks charge based on actual IOPS usage, making the previous three months of usage a critical input for accurate cost modeling.
Conclusion
In summary, by conducting a detailed cost and usage analysis of deployed storage Disks — along with a solid understanding of provisioned Disk capabilities and pricing models — and by effectively implementing optimization strategies, significant value can be unlocked for Azure Managed Disks. Specifically, Premium V2 Disks present compelling savings opportunities compared to Premium (V1) Disks across various scenarios, while Standard Disks provide a cost-effective alternative to both Premium tiers.
To capitalize on these opportunities, the first step is to analyze your existing fleet of Disks. Collecting this data allows you to identify Disks that are significantly over-provisioned — whether in storage capacity or IOPS — highlighting opportunities for both cost reduction and provisioning optimization. This initial phase aligns with the Inform stage of the FinOps lifecycle, focusing on gaining a clear understanding of the composition and costs of currently deployed provisioned Disks.
A solid understanding of the benefits and drawbacks of each Disk type is essential. For example, Premium (V1) Disks provide preset IOPS/throughput levels for specific Disk sizes. Premium V2 Disks, on the other hand, have a much more flexible provisioning model, which can result in significant cost savings in a variety of situations, but also have some functional limitations that need to be considered. Standard Disks are another cost-effective option that can be beneficial in certain contexts. This analysis falls within the Optimize phase of the lifecycle: identifying optimization opportunities, evaluating the applicability of different options, and quantifying the cost savings that can be realized from taking appropriate actions.
Finally, implementing the necessary actions to optimize provisioned Disks falls within the Operate Phase in the FinOps Framework. To sustain the value of these optimizations over the long term, it is crucial to embed ongoing activities — such as reviewing Disk costs, identifying optimization opportunities, and executing corrective measures — into the regular workflows of your FinOps and operational teams.
References
- Premium V2 Limitations: Select a Disk type for Azure IaaS VMs – managed Disks – Azure Virtual Machines | Microsoft Learn (as of 27-Mar-25)
- Convert managed Disks storage between different Disk types – Azure Virtual Machines | Microsoft Learn (as of 27-Mar-25)
- Azure Storage pricing page: Azure Pricing
- Azure Monitor Disk Metrics: Disk metrics – Azure Virtual Machines | Microsoft Learn (as of 8-Apr-25)
- Azure Monitor REST APIS: Azure Monitor REST API reference | Microsoft Learn
Acknowledgements
We’d like to thank the following people for their work on this Paper: