FinOps for Streaming and Real-Time Data Platforms to Optimize Value
Summary: Real-time platforms have a cost profile unlike anything else in the technology estate. Always-on baselines, replication multipliers across storage and network, stateful workloads that resist scale-down, and compounding operational overhead break the standard rightsizing heuristics and tag-based allocation models built for stateless services and batch workloads.
The four FinOps Framework Domains apply cleanly to streaming, but with distinctive intensity. Ingestion has to join broker, processor, storage, and network metrics to billing data before allocation can split shared platform costs by what teams actually consume. Unit economics turn shared infrastructure into a value conversation. Optimization must respect resilience buffers, not only utilization targets. Governance works through policy and education, not gatekeeping.
Streaming usually costs more than batch. The incremental spend buys sub-second personalization, live fraud prevention, and real-time operational intelligence that batch cannot deliver.
The right question isn’t whether streaming is cheap; it’s whether the value-to-cost ratio is improving. Disciplined FinOps, applied to the specifics of real-time infrastructure, is how teams keep it moving the right way.
Table of Contents
- Executive Summary
- Understanding Real-Time Data Platform Workloads
- Key FinOps Challenges
- FinOps-Driven Solutions and Best Practices
- Practical Implementation Examples
- Tools and Observability Stack
- Best Practices and Recommendations
- Advanced Techniques
- Future Trends in Streaming and FinOps
- Conclusion
- Acknowledgements
Executive Summary
Real-time data platforms built on technologies such as Apache Kafka, Apache Flink, and ClickHouse have become foundational to modern digital products. They power capabilities that batch architectures cannot deliver: sub-second personalization, real-time fraud prevention, live operational intelligence, and the customer experiences that depend on near-instant feedback.
They also carry a cost profile unlike anything else in the technology estate. The infrastructure is always on, even when traffic is quiet. Data is replicated several times over for resilience. Stateful workloads cannot be turned off between jobs. And the operational overhead of running these platforms quietly compounds. Standard cost-management approaches, designed for stateless services and batch workloads, do not translate cleanly. Treating real-time platforms with the same heuristics used elsewhere leads either to runaway cost or to optimization decisions that compromise the resilience these systems exist to provide.
The FinOps Framework offers an operating model purpose-built for this kind of variable, business-critical spend. This paper applies that model to real-time platforms across all four FinOps Domains. It shows how unit economics change the conversation from “what does streaming cost” to “is the value-to-cost ratio improving.”
Real-time platforms usually cost more than batch alternatives in absolute terms, and they almost always should because that is what unlocks the capabilities the business is paying for. The right question is not whether streaming is cheap. It is whether the incremental value justifies the spend, and whether the practice is disciplined enough to keep that value-to-cost ratio improving over time. For Leadership Personas weighing investment in real-time capabilities, this paper offers a practical framework for answering both questions, along with worked examples grounded in the realities of running these platforms at scale.
Understanding Real-Time Data Platform Workloads
Real-time data platforms have moved from niche tooling to the backbone of modern digital products. Event streams feed customer analytics, fraud detection, observability pipelines, trading systems, and user experiences that depend on near real-time feedback. Technologies such as Apache Kafka, Apache Flink, and ClickHouse make it possible to ingest, process, and query these streams at scale.
Unlike batch jobs that run in discrete windows, streaming systems are almost always on. Brokers, stream processors, and serving layers must stay available so that events can be accepted and processed as soon as they arrive. This is ideal for the business, but it creates a new class of cost challenge. There is a constant baseline of compute, storage, and network spend even when user traffic is quiet.
FinOps brings financial accountability to this variable spend, and the FinOps Framework provides the operating model for aligning FinOps Practice activities to the outcomes defined by the Framework Domains: Understand Usage & Cost, Quantify Business Value, Optimize Usage & Cost, and Manage the FinOps Practice. Real-time platforms fit this model, but they also stress it. Cost is driven not only by compute, but also by replication, long-term retention, cross-region traffic, and the engineering time required to operate complex stateful systems. Several characteristics make these workloads different from traditional batch processing and directly influence their cost profile.
Always-on processing and stateful operations
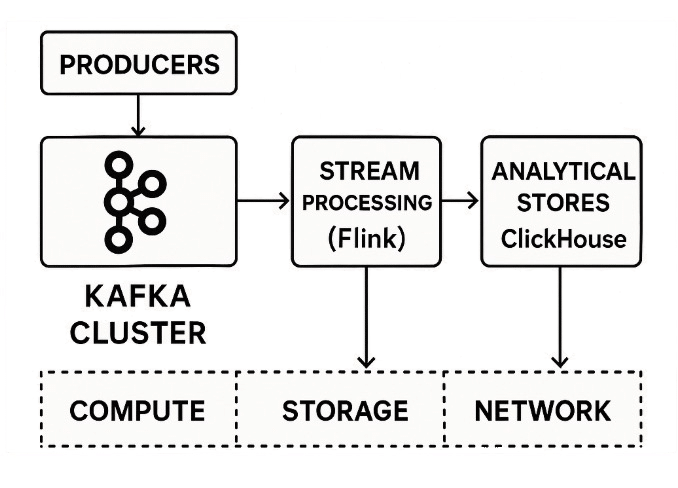
Streaming systems are designed around the assumption that data can arrive at any time. Brokers, coordinators, and processing jobs therefore run continuously. Even with low message volume, a minimum number of brokers is required to keep partitions and replicas healthy. Stateful processors need enough replicas to survive failures without breaching availability or latency targets.
Frameworks such as Flink maintain local or remote state and create periodic checkpoints for fault tolerance. The more complex your logic and the longer your keyed windows, the more state you hold. That state translates directly into storage, I/O, and CPU for compaction and checkpointing. This creates what many teams experience as an always-on tax, a baseline cluster footprint that needs explicit budgeting and forecasting and cannot easily be scaled down.
High availability and resilience requirements
Real-time platforms often support business-critical workloads such as payments, trading, security analytics, or operational monitoring. To meet availability and durability targets, brokers replicate each message across multiple nodes (typically a replication factor of three) and stream processors run with standby replicas that can take over within seconds of a failure.
This design is essential for resilience, but it multiplies cost. Each message produces several disk writes and network transfers. Stream processing jobs are also deployed with redundancy so that a single node failure does not interrupt pipelines. From a FinOps perspective, the challenge is to define what level of redundancy is required and to avoid capacity that adds cost without meaningful risk reduction.
Cost drivers and unit economics
FinOps teams benefit from looking at streaming platforms through unit economics rather than only total monthly spend. Useful metrics include cost per million messages, cost per gigabyte retained, and cost per consumer group. These metrics align with the Unit Economics Capability in the Quantify Business Value Domain. They help FinOps Practitioners, Product, and Engineering Personas make tradeoffs visible, and allow them to understand the cost impact of new features.
Key cost drivers include:
- Compute: vCPUs and memory for brokers, stream processors, and supporting services such as schema registry and connectors.
- Storage: local disks for broker logs and state stores, plus any object storage used for tiered storage and checkpoints.
- Network: cross-availability-zone replication, cross-region replication, and egress to external systems and users.
- Operations: platform engineering time for upgrades, capacity management, incident response, and tuning.
To ground these ideas, Table 1 compares the high-level cost characteristics of streaming and batch workloads.
| Dimension | Streaming (real-time) | Batch |
|---|---|---|
| Execution pattern | Continuous event processing, always on | Runs in scheduled windows or on demand |
| Elasticity | Limited scale-down, brokers and stateful jobs must stay online | Clusters can be scaled down or shut off between jobs |
| Typical cost drivers | Base cluster size, replication, state storage, cross-region traffic | Job runtime, transient compute and temporary storage |
| FinOps focus | Managing base cost, retention, and multi-tenant sharing | Rightsizing jobs and scheduling for off-peak windows |
Table 1: Cost characteristics of streaming versus batch processing.
Key FinOps Challenges
With workload characteristics in mind, the next step is to understand why streaming platforms are hard to manage from a FinOps point of view. Traditional approaches that work for stateless services or one-off batch jobs do not always translate to multi-tenant, always-on clusters.
Resource management and rightsizing
Streaming clusters often look oversized in standard utilization dashboards. CPU and memory may sit well below 50 percent for long periods, even though the platform team is reluctant to reduce capacity. This is not simple waste. Brokers need headroom to absorb failover and to handle partition movement. Stateful processors cannot scale down quickly without expensive rebalancing and state migration.
The result is that classic rightsizing heuristics, such as pushing utilization toward 70 to 80 percent, can be unsafe for streaming. FinOps and platform teams need a shared understanding of what portion of apparent headroom is a resilience buffer and what portion is true overprovisioning.
Management of shared platform costs
A second challenge is cost attribution. Many FinOps practices rely on simple mappings between resources and owners. A data warehouse job, microservice, or virtual machine can often be tagged and billed to a single cost center. Kafka clusters and Flink jobs are different. Multiple teams share the same brokers and processing infrastructure, and topics fan out to many consumer applications.
If you split the monthly Kafka bill equally across topics or teams, you will overcharge some and undercharge others. Heavy producers drive storage and replication cost. Stateful consumers drive CPU and memory usage elsewhere. A useful attribution model must combine infrastructure cost with usage metrics such as throughput and retained bytes and then tie those two to teams through metadata.
Storage and network as hidden multipliers
Storage and network are often the largest cost lines for streaming, yet they are easy to underestimate. Generous retention policies, combined with replication, can multiply raw data volume several times. Cross-region replication and chatty consumer patterns add additional network charges.
From a FinOps perspective, storage and network are attractive targets because savings can be significant without changing business logic. The hard part is building enough visibility and ownership to act on them safely.
Cost visibility and reporting
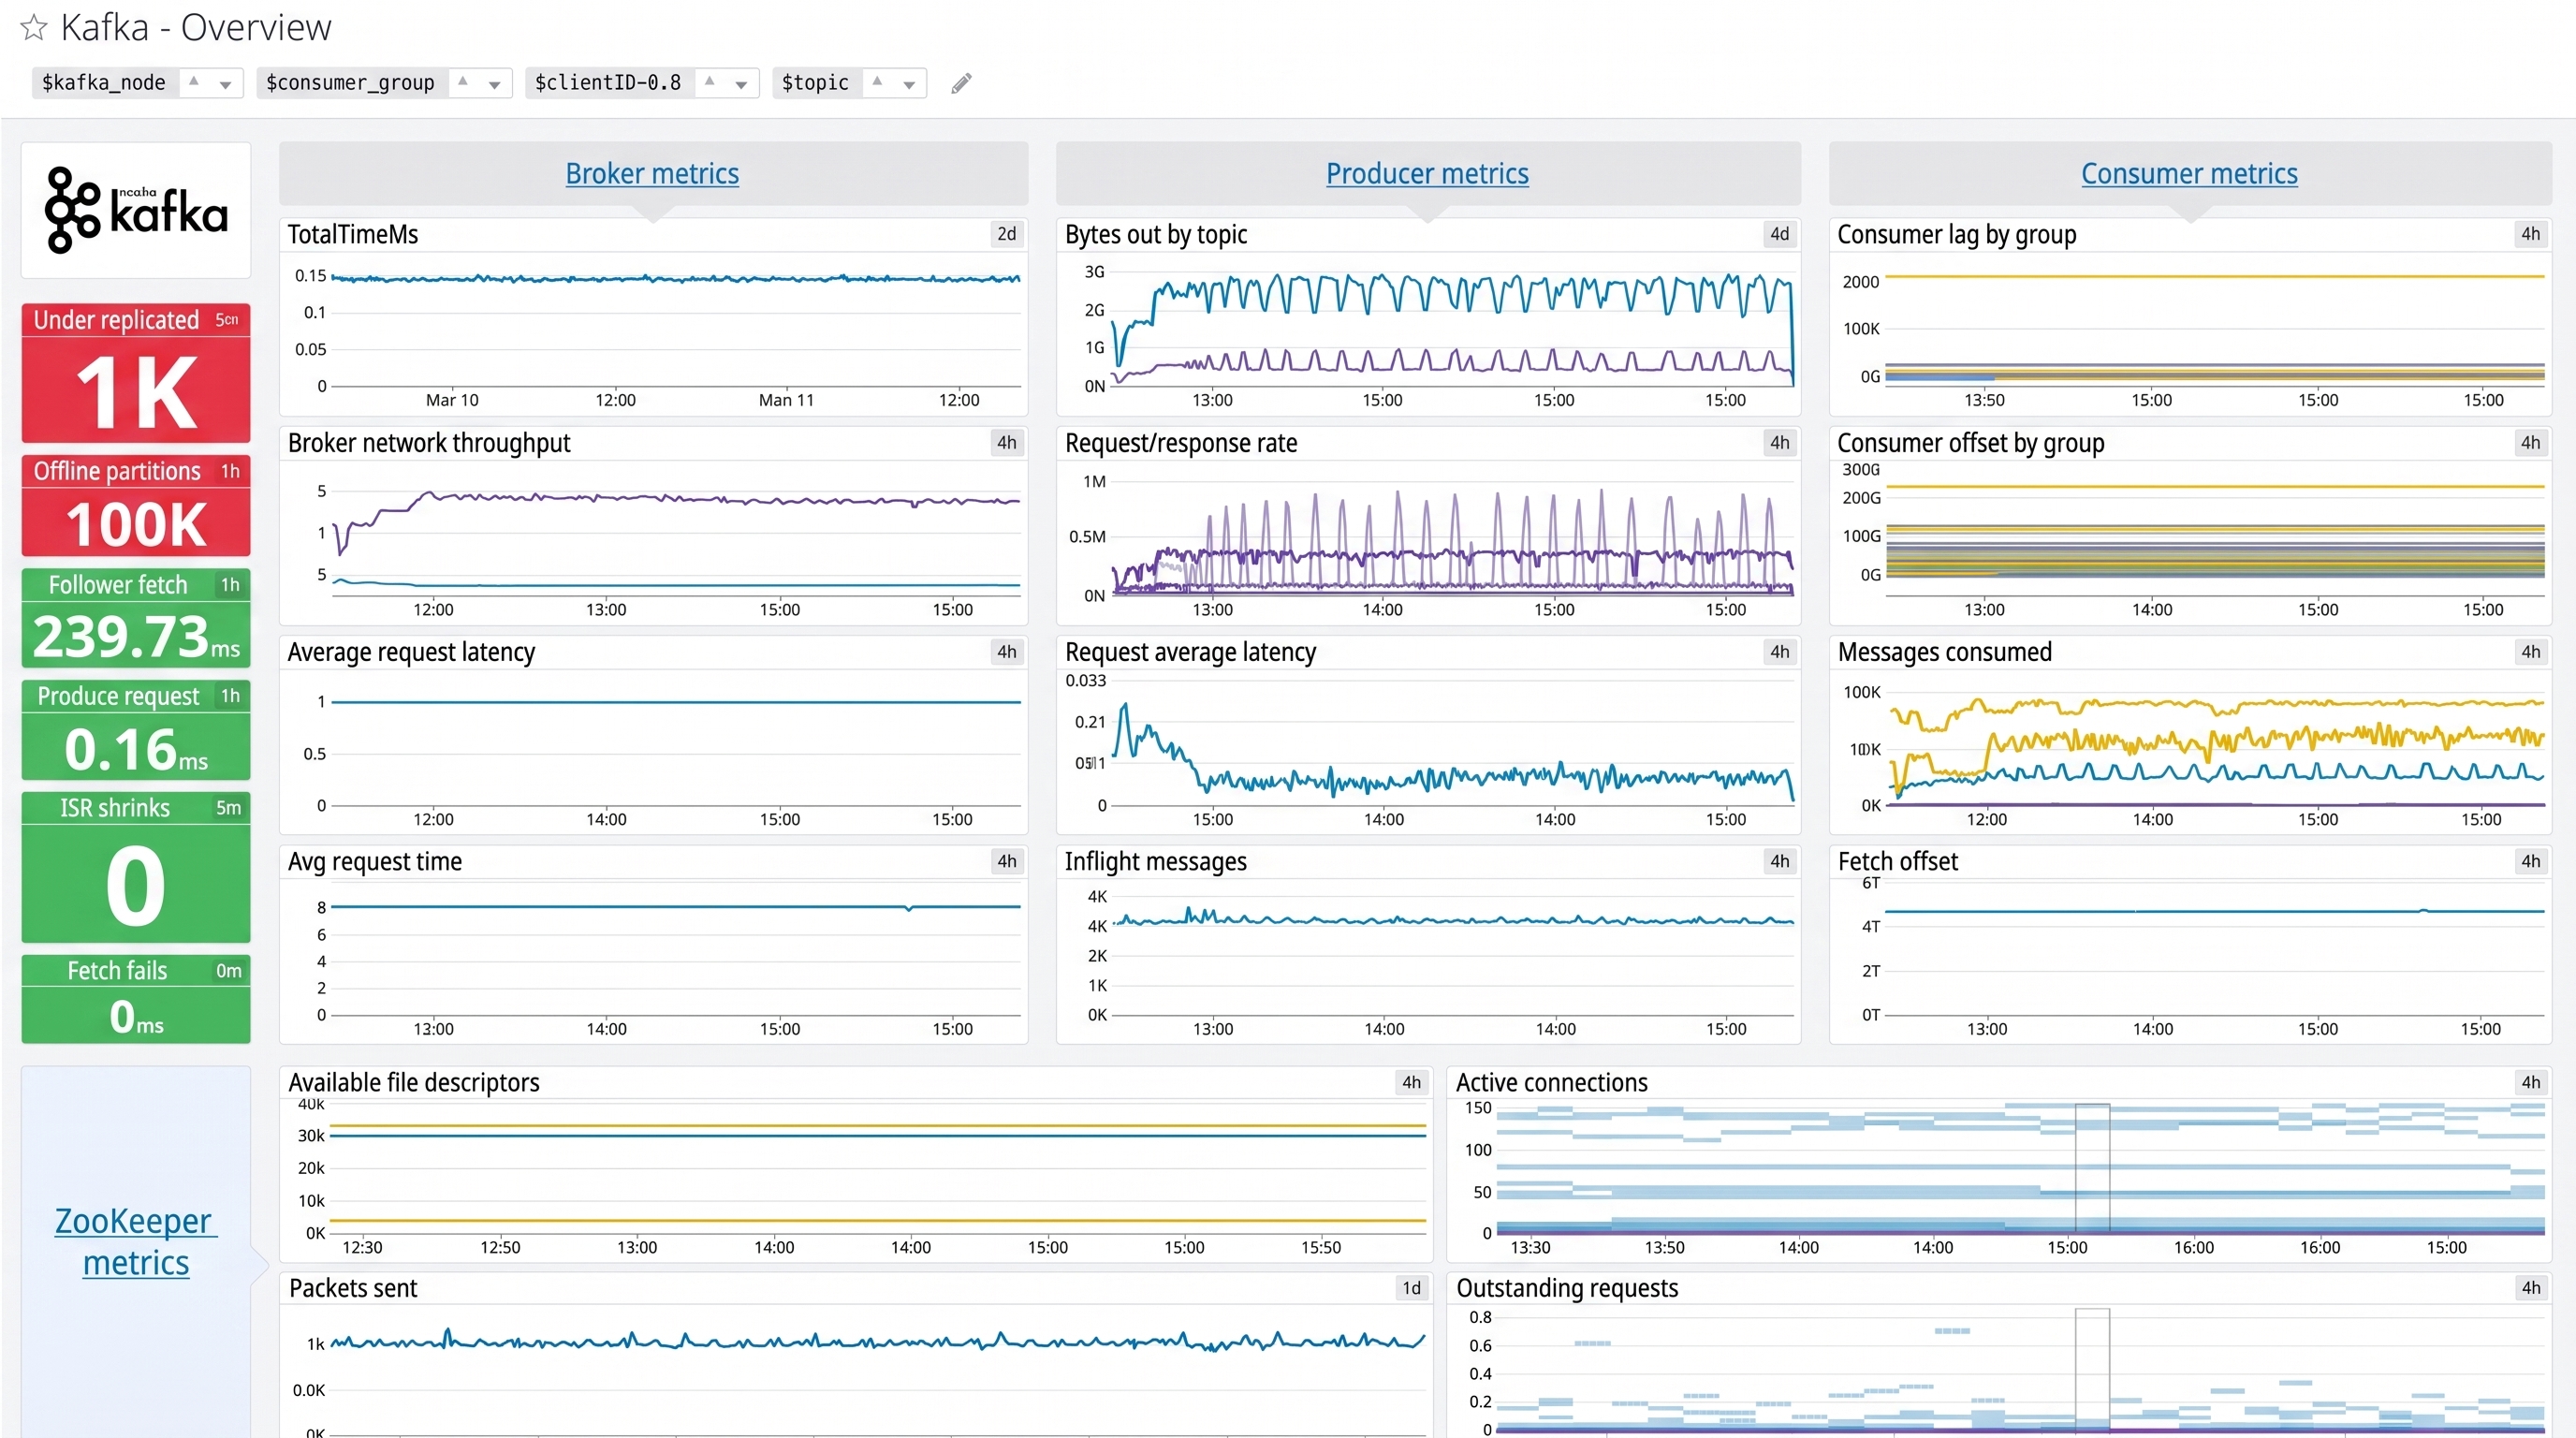
Operational dashboards for Kafka and Flink focus on health signals such as throughput, consumer lag, and error rates. Cost is usually absent. Engineers can see instantly if a job is unhealthy, but they rarely see how much it costs. FinOps teams, in turn, may only see high-level service names in cloud bills, which are hard to relate back to topics and pipelines.
A strong FinOps practice for streaming introduces shared views that link cost to engineering concepts. Example questions that these views should answer include:
- Which topics and teams account for most of our Kafka storage spend?
- How much does it cost per month to keep a specific topic with a given retention period?
- What is the end-to-end cost of a critical streaming pipeline from ingestion to serving?
FinOps-Driven Solutions and Best Practices
Tackling streaming costs effectively requires more than ad hoc cleanup work. The most successful organizations treat FinOps as an ongoing practice that combines visibility, value quantification, optimization, and governance. The FinOps Framework organizes this work into four Domains: Understand Usage & Cost, Quantify Business Value, Optimize Usage & Cost, and Manage the FinOps Practice. Each contains a set of Capabilities that Practitioners, Engineering, Product, Finance, and Leadership Personas develop together. The sections below map each Domain to concrete activities for streaming infrastructure.
Understand Usage & Cost
This Domain produces the shared, trustworthy view of cost and usage that every other Domain depends on. For streaming, the work centers on three Capabilities: Data Ingestion (pulling broker, processor, storage, and network metrics into one place alongside billing data), Allocation (distributing shared platform costs fairly across topics, consumer groups, and teams), and Reporting & Analytics (surfacing that data to the Personas who need it). The Anomaly Management Capability rounds out the Domain and is covered a bit further down in this paper. The goal is not perfect precision. Instead, you want a model that is fair, transparent, and easy to implement using available metrics.
Multi-dimensional attribution model
A practical allocation approach for Kafka-based platforms is to distribute broker and storage costs using topic throughput and log size, while distributing stream processing compute using job-level metrics such as CPU usage and processed events. A simple model works as follows:
- Take the total monthly Kafka broker cost, including compute, storage, and an allocated portion of operations overhead.
- For each topic, measure throughput in bytes per second or messages per second, averaged across the month.
- Calculate each topic’s fraction of total throughput and allocate a corresponding portion of broker and network cost to that topic.
- Assign storage cost per topic using log size or retained bytes, adjusted for the configured replication factor.
- Associate every topic and consumer group with an owning team or product area, using labels or other metadata maintained for this purpose.
- Roll attributed costs up from individual topics to teams and then to business units for reporting at each level.
This model can be refined over time. You may want to down-weight internal infrastructure or control topics so they do not distort allocations. You might also treat disaster recovery replication as a separate cost category, allocated only to workloads that require cross-region durability. Where FOCUS-conformed billing data is available, use it. The standard columns make allocation logic portable across providers and easier for Finance Personas to consume.
Code example 1: Simple topic-level cost allocation formula
The following pseudocode illustrates a simple way to allocate Kafka broker cost to topics based on throughput:
total_broker_cost = 30000  # monthly GBP
total_throughput_bytes = sum(topic.throughput_bytes for topic in topics)

for topic in topics:
    share = topic.throughput_bytes / total_throughput_bytes
    topic.allocated_cost = total_broker_cost * share
    print(topic.name, round(topic.allocated_cost, 2))
Metrics and dashboards
Once you have an attribution model, the next step is to surface it through the Reporting & Analytics Capability in dashboards that engineers and leaders will actually use. A useful pattern is to build three primary views aligned to Personas:
- Leadership view: high-level trends in total streaming spend, cost by business unit, and unit cost metrics such as GBP per million messages.
- Engineering view: cost by cluster, by component (Kafka, Flink, ClickHouse, network), and by environment (production, staging, development).
- Product view: cost by topic, consumer group, and pipeline, with easy filters for team and product line.
These dashboards should sit alongside operational views in tools such as Grafana. A topic detail dashboard might show throughput, partition count, consumer lag, storage usage, and allocated monthly cost side by side. This reinforces the idea that cost is another dimension of system health.
| Stage | Component | Primary cost driver | Allocated cost (GBP/month) |
|---|---|---|---|
| Ingestion | Kafka topic: events.raw | Broker storage and replication | 6,000 |
| Processing | Flink job: enrich_events | Stateful processing CPU and memory | 4,000 |
| Serving | ClickHouse table: events_agg | Columnar storage and queries | 3,500 |
| Replication | Cross-region Kafka mirror | Network egress and ingress | 2,500 |
Table 2: Example cost map for a simple streaming workflow.
Quantify Business Value
Understanding what streaming costs is necessary but not sufficient. The Quantify Business Value Domain connects that cost to the outcomes it produces, so that decisions about real-time capabilities are made on a value basis rather than a savings basis alone. Four Capabilities matter most for streaming: Unit Economics, Forecasting, Budgeting, and Planning & Estimating. KPIs & Benchmarking ties them together.
Unit economics for streaming
Streaming platforms lend themselves to unit economics thinking because the work is naturally measurable: messages produced, bytes retained, decisions served, consumers fanned out. Useful unit cost metrics include:
- Cost per million messages processed, the most general benchmark and the easiest to compare across designs and vendors.
- Cost per GB retained per day, which exposes the impact of retention policy and replication factor.
- Cost per consumer group, useful when shared platforms host many downstream applications.
- Cost per decision served, where the streaming pipeline backs a business-facing capability such as fraud scoring or personalization.
These metrics are the practical implementation of the Unit Economics Capability for real-time platforms. They let Engineering, Product, and Finance Personas have the same conversation about whether a new feature, a new consumer, or a new region is worth what it costs.
Forecasting and budgeting an always-on baseline
Streaming platforms have a forecasting profile that batch workloads do not: a significant baseline of compute, storage, and replication runs whether traffic is heavy or light. Treat that baseline as a first-class forecasting input. The Forecasting Capability for streaming typically separates three components:
- Baseline platform cost: broker count, processor replicas, hot-tier storage, and standing operations overhead. This component is predictable and should be forecast at high confidence.
- Variable workload cost: throughput-driven processing, fan-out, and warm and cold storage growth. Forecast this against expected business volume drivers such as active users, transactions, and devices.
- Cross-region and disaster recovery cost: usually budget-line-worthy in its own right because it scales with policy choices rather than traffic alone.
For Budgeting, separating these components allows Finance Personas to set distinct budgets and review cadences for each. A 10 percent overrun on baseline cost is a very different signal from a 10 percent overrun on variable cost, and conflating them obscures both.
KPIs, benchmarking, and value framing
Unit cost metrics become most powerful when paired with business KPIs. For a fraud detection pipeline, that might be loss prevented per thousand decisions. For a personalization pipeline, it might be incremental conversion lift attributable to real-time features. For an observability pipeline, it might be mean time to detection. The KPIs & Benchmarking Capability provides the structure to pair cost and value metrics so the value-to-cost ratio can be tracked over time.
This is also where the streaming-versus-batch tradeoff becomes a productive conversation rather than a budget argument. Streaming usually costs more in absolute terms; the relevant question is whether the incremental value justifies the incremental spend, and benchmarking unit costs against batch alternatives and managed-service offerings keeps that question grounded.
Normalizing cost across self-managed and managed platforms
When you compare self-managed Kafka on virtual machines with a managed Kafka SaaS offering, headline prices may not tell the whole story. A FinOps analysis treats each option as a bundle of cost drivers and then normalizes them into comparable unit economics.
A practical way to do this is to break each platform down into components. Table 3 shows an example normalization for two designs supporting the same workload.
| Dimension | Self-managed Kafka on EC2 | Managed Kafka SaaS |
|---|---|---|
| Compute and baseline cluster | 6 medium brokers on EC2, sized for peak throughput and HA | Single managed cluster with autoscaling within a defined throughput band |
| Storage model | Local SSDs on EC2 (hot tier) plus external S3 bucket for older segments | Storage included in per-GB pricing up to a quota; optional archival tier billed separately |
| Replication defaults | Replication factor 3 across AZs; mirror cluster in a second region run by a platform team | Provider defaults to replication factor 3 within a region; cross-region mirroring offered as an add-on service |
| Pricing structure | EC2, EBS/SSD, S3, and data transfer charged separately; no per-partition fee | Per-partition or per-throughput charges for brokers, plus per-GB/month storage and per-GB data transfer |
| Operational overhead (SRE proxy) | Around 1.5 FTE of SRE/platform engineering for patching, upgrades, scaling, and incidents | Around 0.5 FTE of FinOps/platform engineering focused on configuration, usage controls, and vendor management |
Table 3: Example normalization for two designs supporting the same workload.
To put these designs on equal footing, convert each line item into an effective monthly cost per million messages and per GB retained. For the self-managed cluster, that means rolling up EC2, storage, network, and SRE effort into a total monthly platform cost and dividing by actual throughput and retained data. For the managed service, include per-partition or throughput charges, bundled storage, data transfer, and the platform engineering time needed to manage configuration and policies.
Once you have unit costs for both options (for example, 1.40 GBP per million messages and 0.06 GBP per GB-day for self-managed versus 1.65 GBP per million messages and 0.05 GBP per GB-day for managed), the tradeoffs become clearer. The managed service may show a higher cost per million messages but lower operational overhead and smoother scaling, while the self-managed option may be cheaper at scale but more exposed to misconfigurations and under-resourced operations.
Building a simple evaluation checklist for your FinOps and architecture team could include questions such as:
- Can we quantify effective cost per million messages and per GB-day for each option, including storage, network, and other costs?
- How do replication defaults and cross-region features shift those unit costs as resilience requirements increase?
- Does per-partition or per-throughput pricing introduce incentives or anti-patterns, such as an excessive number of small partitions?
- At what traffic level does the total cost of ownership of self-managed infrastructure cross over the managed service once SRE effort and incident risk are factored in?
Normalizing in this way keeps vendor choices anchored in the Unit Economics Capability rather than in price sheets, and gives Leadership Personas a comparison they can revisit as volume and requirements evolve.
Optimize Usage & Cost
Once cost is allocated and value is quantified, you can act. For streaming, the most repeatable savings come from three Capabilities working together: Usage Optimization (rightsizing, retention, cleanup of active topics no longer needed by the business), Architecting & Workload Placement (where data lives, how it flows, what gets replicated), and Rate Optimization (commitments and managed-service pricing). The Sustainability Capability is increasingly relevant given streaming’s always-on energy profile, and Licensing & SaaS matters wherever managed streaming services are in play. The goal is to optimize for value without degrading reliability or user experience.
Typical optimization levers include:
- Compute rightsizing (Usage Optimization): measure broker and job utilization over at least 30 days, define safe target ranges that account for resilience buffers, and adjust instance sizes or counts where utilization is consistently low.
- Storage policies (Usage Optimization): standardize retention by data classification, introduce tiered storage so cold data moves to cheaper media, and clean up unused topics and tables.
- Network-aware placement (Architecting & Workload Placement): co-locate consumers with brokers, apply compression on producer and replication links, and be selective about which topics cross region boundaries.
- Traffic shaping (Usage Optimization and Architecting & Workload Placement): batch small messages into larger request payloads at the producer, apply client-side throttling to smooth bursty traffic against expensive downstream systems, and consolidate related events into shared topics where consumer requirements allow.
- Payload design principles (Usage Optimization): treat message schemas as a cost surface, not just an interface contract. Choose efficient serialization formats such as Avro or Protobuf over verbose ones such as JSON for high-volume topics, avoid embedding data that consumers can look up separately, and version schemas deliberately so that adding fields does not silently inflate every message on the topic.
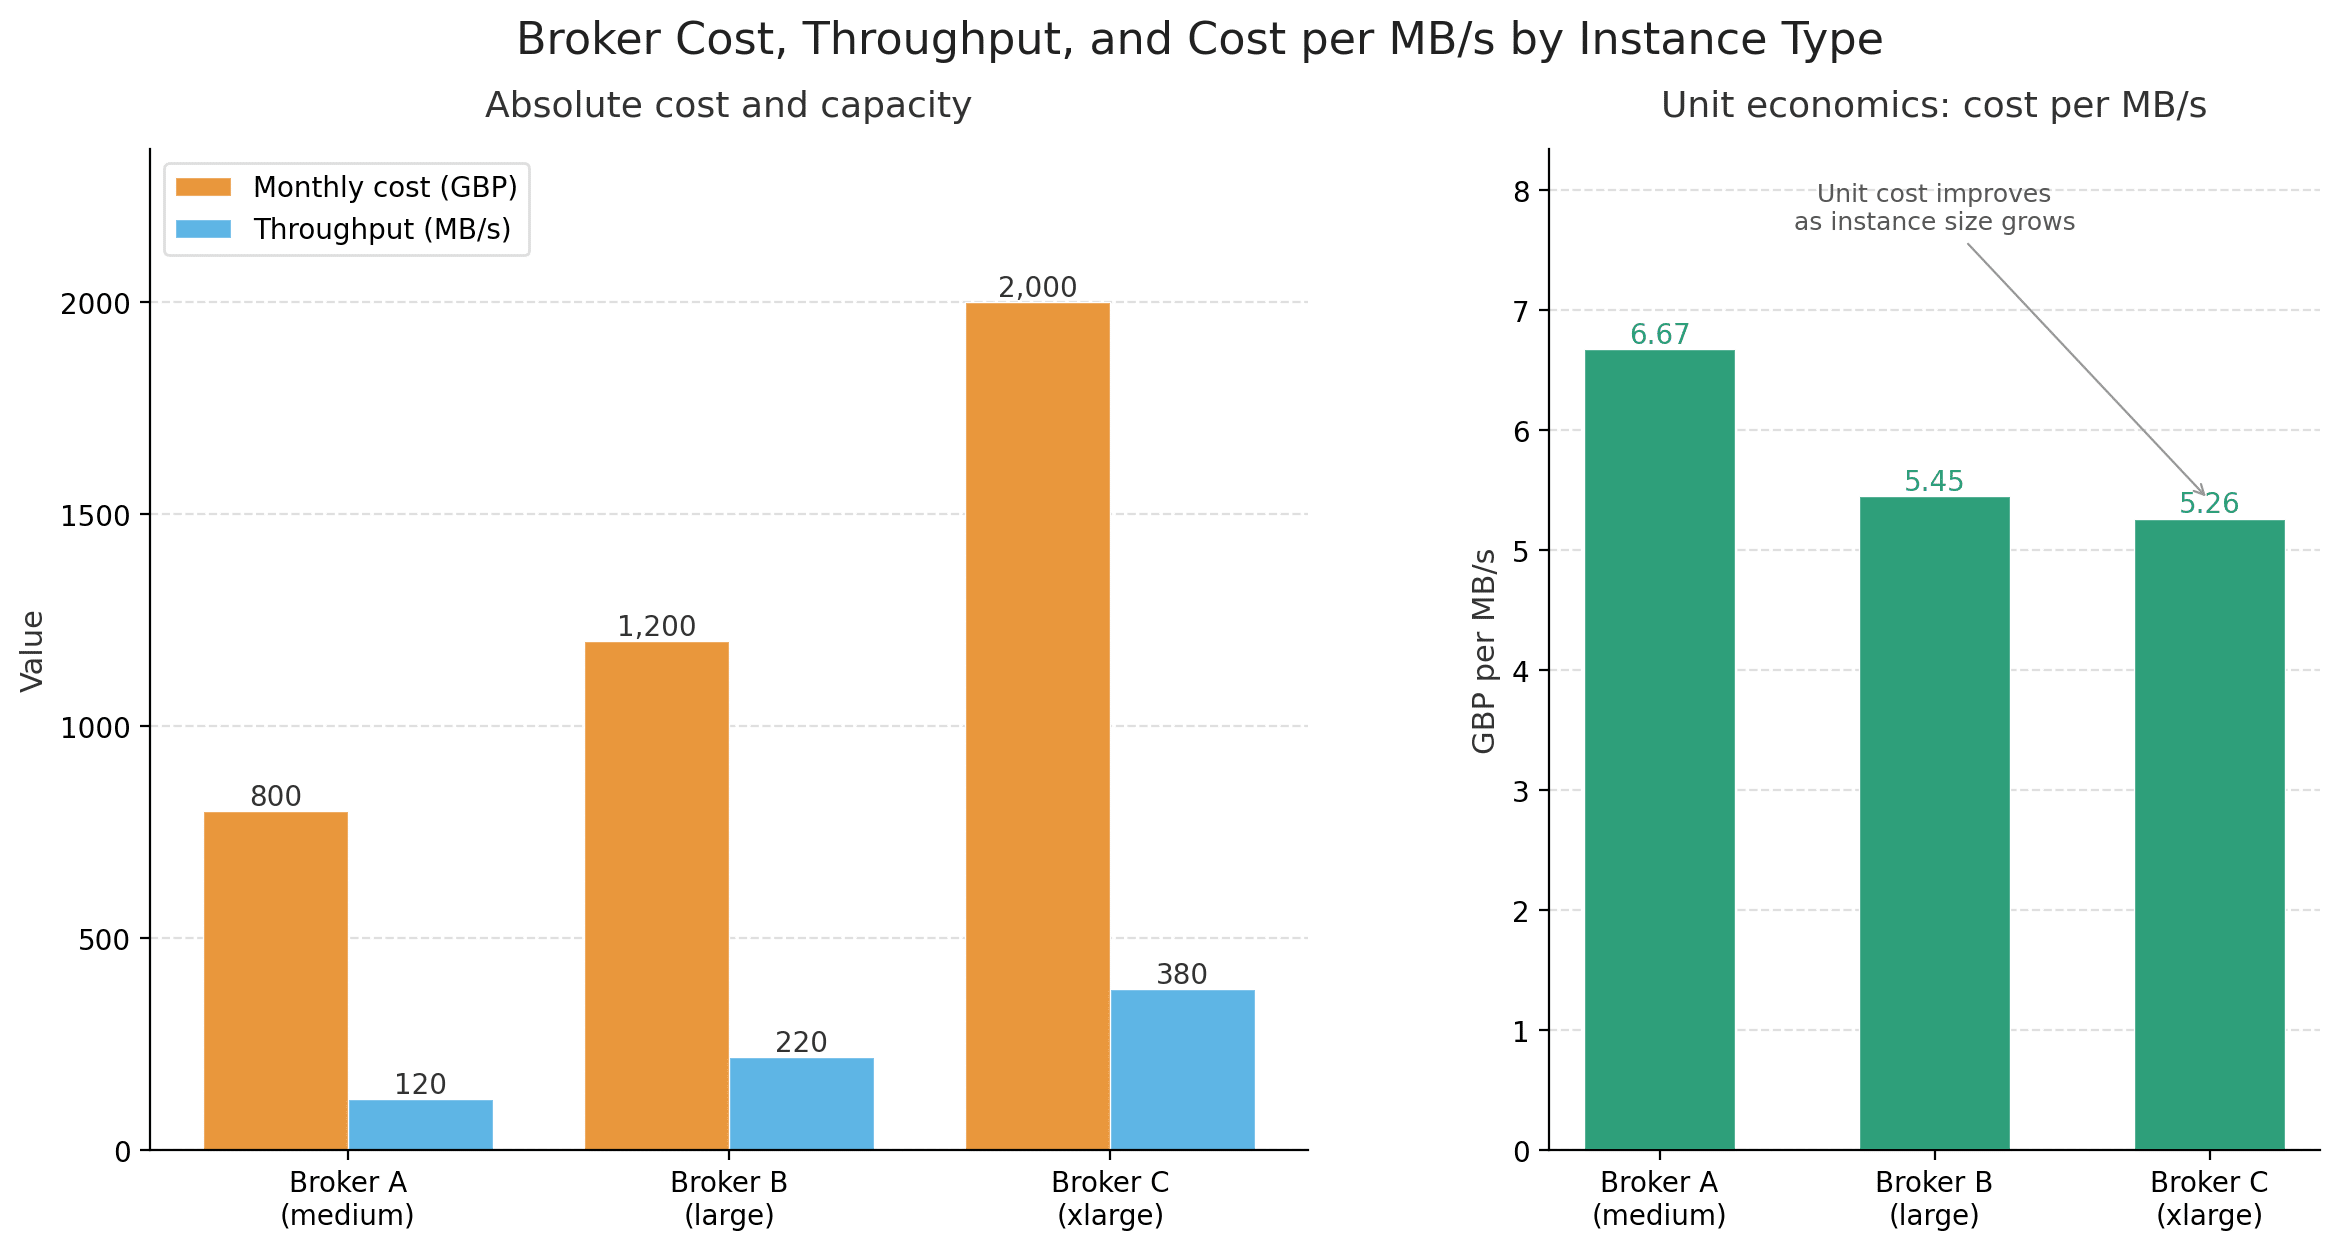
| Instance type | Approx monthly cost (GBP) | Sustainable throughput (MB/s) | Cost per MB/s (GBP) |
|---|---|---|---|
| Broker A (medium) | 800 | 120 | 6.67 |
| Broker B (large) | 1,200 | 220 | 5.45 |
| Broker C (xlarge) | 2,000 | 380 | 5.26 |
Table 4: A simple example of trading off broker instance types to reduce unit cost without compromising headroom.
Storage optimization
Storage optimization typically offers some of the fastest and least risky savings. A structured approach includes:
- Inventory all topics and analytical tables, including retention, size, and owning team.
- Categorize topics by data classification and business criticality, such as critical, important, and experimental.
- Define standard retention policies per category, for example 7 days for critical, 3 days for important, 24 hours for experimental.
- Introduce tiered storage so that older segments move to cheaper object storage while recent data stays on faster local disks.
| Compression codec | Relative compression ratio | CPU cost | Typical use case |
|---|---|---|---|
| LZ4 | Good | Low | High throughput topics where latency matters |
| Snappy | Moderate | Low to moderate | General purpose workloads |
| Zstd | Very high | Higher | Archival or cross-region replication where bandwidth is expensive |
Table 5: Comparison of common compression algorithms for streaming data.
In practice, many teams find that moving from no compression to LZ4 or Snappy yields immediate savings in both storage and network cost with minimal performance impact. For cross-region replication, Zstd often delivers the best tradeoff because bandwidth tends to be significantly more expensive than CPU.
Network and placement optimization
Network cost optimization sits squarely in the Architecting & Workload Placement Capability and typically requires close collaboration between platform and application teams. Useful techniques include:
- Co-locating consumers with brokers in the same availability zone or region wherever possible.
- Reducing unnecessary fan-out by consolidating consumers or introducing shared processing stages.
- Applying compression on the wire for producers and replication links.
- Being selective about which topics are replicated across regions, based on clear business requirements.
Treat cross-region replication as its own cost category with an explicit budget. Teams that need globally available data can then make conscious tradeoffs about which subsets truly need to be mirrored and at what level of freshness.
Rate optimization through commitments
Because streaming platforms have a significant and predictable base load, they are strong candidates for the Rate Optimization Capability. A simple strategy separates baseline from burst:
- Estimate the minimum brokers and processing nodes you expect to need over the next 12 to 36 months.
- Cover 60 to 80 percent of that baseline with reserved instances, savings plans, or equivalent commitments.
- Use on-demand or autoscaled capacity for the remaining 20 to 40 percent that absorbs spikes and new workloads.
- Review coverage quarterly to confirm actual usage aligns with reserved commitments.
The same principle extends to SaaS streaming. Managed Kafka and Flink offerings such as Confluent Cloud, MSK, and Aiven typically offer committed-use discounts that, combined with the Licensing & SaaS Capability, materially reduce unit cost on predictable baseline throughput. Rate Optimization works best when paired with strong Usage Optimization. You want confidence that the baseline you are committing to is actually needed.
Manage the FinOps Practice
For streaming infrastructure, the most relevant outcomes are driven by Capabilities such as Governance, Policy & Risk (policies and guardrails for shared platforms), Automation, Tools & Services (lifecycle automation, cost tooling), FinOps Education & Enablement (giving engineers cost data alongside operational data), and Executive Strategy Alignment (build-versus-buy decisions, architecture strategy, vendor selection). Invoicing & Chargeback is relevant where streaming costs are formally distributed to business units.
Cadences and continuous review
Streaming environments are dynamic. New teams onboard, traffic shifts, features evolve. Practical patterns include:
- Regular capacity reviews bringing FinOps Personas together to review utilization, risk, and planned growth.
- Quarterly retention reviews as a lightweight, high-impact activity.
- Architecture review checkpoints that examine cross-region replication, fan-out patterns, and stateful job design against current value drivers. This feeds back into the Executive Strategy Alignment Capability when significant build-versus-buy decisions arise.
- Guardrails or policies that block changes when projected cost breaches thresholds, for example long-retention topics in development environments.
Automation for topic and resource lifecycle
The Automation, Tools & Services Capability shows up in streaming primarily through topic-lifecycle automation: scheduled checks for unused topics, old consumer groups, and orphaned storage, integrated with chat or ticketing so that owning teams approve cleanups. Integrate this kind of check with internal tooling or chat-based notifications so that teams review and approve deletions rather than relying on automatic action.
Code example 2: Conceptual cleanup script for unused topics
Below is conceptual pseudocode that flags Kafka topics which appear unused and may be candidates for cleanup:
for topic in list_topics():
    if topic.consumer_lag == 0 and topic.write_rate == 0 and topic.age_days > 30:
        print(f"Candidate for cleanup: {topic.name}, size={topic.size_gb}Gi, age={topic.age_days} days")
        # In practice, create a ticket or send a notification instead of deleting automatically
Education, enablement, and shared ownership
The FinOps Education & Enablement Capability matters more for streaming than for many other workloads, because the cost decisions live with engineering teams who see operational dashboards every day and cost dashboards rarely. Putting allocated cost next to throughput, lag, and storage on the same Grafana page is one of the highest-leverage education investments a streaming platform team can make. It changes cost from a quarterly conversation into a daily one.
Practical Implementation Examples
Concrete examples help turn FinOps principles into day-to-day decisions. This section walks through realistic scenarios that illustrate how to compare streaming with batch, interpret cost breakdowns, and map end-to-end pipeline costs. The numbers are illustrative rather than prescriptive, but the patterns generalize to many environments and can be adapted to your own volumes and cloud pricing.
Example: Streaming versus batch cost comparison
Consider a workload that ingests user interaction events, such as page views and clicks, and feeds both a daily reporting dashboard and a near real-time personalization feature. You can implement this using a nightly batch pipeline only, a purely streaming pipeline, or a hybrid where batch covers long-term analytics and streaming powers latency-sensitive features.
In this scenario, streaming costs roughly twice as much as batch in absolute terms. However, the streaming design also supports real-time personalization, anomaly detection, and operational monitoring use cases that batch alone cannot deliver. The FinOps question is not only which option is cheaper, but whether the incremental capabilities of streaming justify the additional spend for your business context.
| Cost category | Batch-only design (GBP/month) | Streaming-only design (GBP/month) |
|---|---|---|
| Compute | 6,000 (nightly cluster, 4 hours) | 12,000 (always-on brokers and processors) |
| Storage | 3,000 (daily snapshots, 90 days retention) | 6,000 (replicated logs, 7 days retention) |
| Network | 1,000 (warehouse egress to BI) | 3,000 (cross-zone traffic and consumers) |
| Operations | 2,000 (data engineering support) | 4,000 (platform SRE and on-call) |
Table 6: Illustrative cost comparison for batch-only and streaming-only designs.
A useful technique is to compute unit costs for each design. For example, if the streaming design costs 25,000 GBP per month all in and processes 15 billion events, the cost per million events is around 1.67 GBP. The batch design might cost 12,000 GBP per month, yielding 0.80 GBP per million events. With these unit costs in hand, you can ask product teams questions such as:
- What additional revenue, retention, or risk reduction does the real-time personalization feature deliver compared to a batch-only approach?
- Are there subsets of traffic, for example high-value customers, where streaming is most valuable, allowing you to keep batch for the rest?
- Does the streaming design reduce operational risk, for example by detecting incidents earlier and shortening mean time to recovery?
Example: Sample cost breakdown for a streaming platform
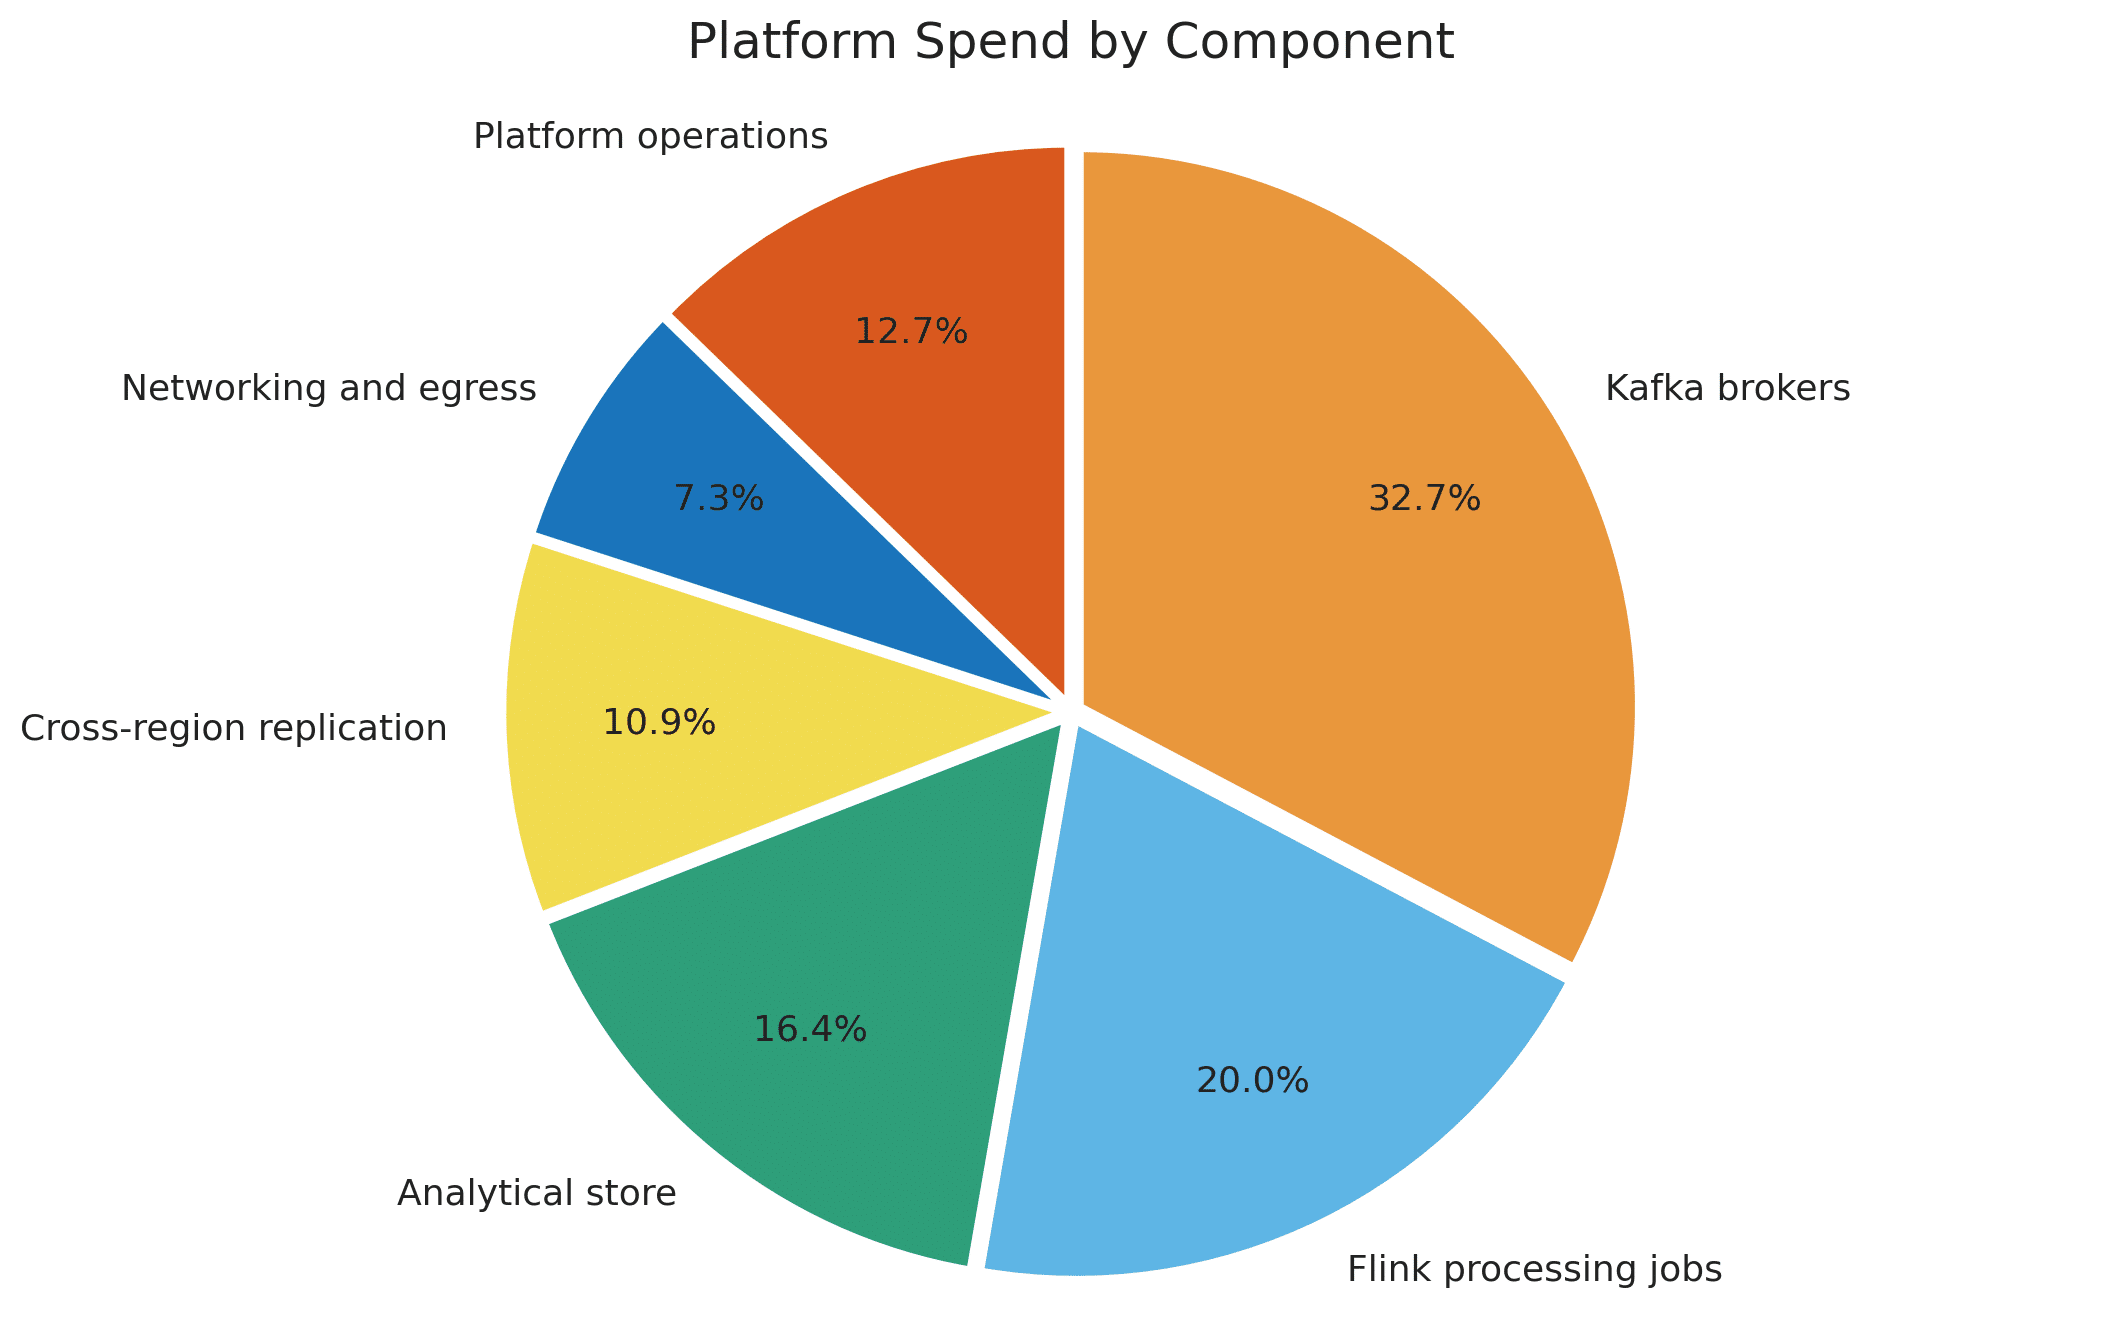
A second example illustrates a platform-level view. Suppose your primary Kafka and Flink cluster supports several product teams and processes around 40 billion messages per month. The cluster runs in a single region with three availability zones, uses local SSDs for hot Kafka storage, and a separate ClickHouse cluster for analytics.
| Component | Description | Monthly cost (GBP) |
|---|---|---|
| Kafka brokers | Compute and local storage for core cluster | 18,000 |
| Flink processing jobs | Stateful processing for enrichment and aggregation | 11,000 |
| Analytical store | ClickHouse cluster for dashboards and APIs | 9,000 |
| Cross-region replication | Kafka mirror cluster for disaster recovery | 6,000 |
| Networking and egress | Data transfer to external services and users | 4,000 |
| Platform operations | Allocated SRE and platform engineering effort | 7,000 |
Table 7: Example monthly cost breakdown for a shared streaming platform.
If this platform processes 40 billion messages per month, the all-in cost per million messages is roughly 1.375 GBP. That unit cost becomes a key benchmark for internal decision making and vendor comparison. You can track how it evolves as you take optimization actions or onboard new workloads. It is also a useful figure when comparing managed services, such as cloud provider streaming offerings, against self-managed clusters.
You can take this example further by segmenting costs by environment. For instance, you might find that 20 percent of broker and processing costs sit in non-production environments where long retention is not truly needed. Tightening policies in those environments is often a low-risk way to free up capacity and budget.
Example: Cost map for an end-to-end streaming workflow
For product teams, it is often more intuitive to see cost mapped onto the workflow they build on top of the platform. Table 8 shows a simplified cost map for a real-time fraud detection pipeline that ingests card transactions, applies rules and machine learning, and serves decisions to an API used by downstream systems.
This view gives product owners an end-to-end picture of how much it costs to run a specific capability. It also highlights where optimization work could have the largest impact. For example, if ingestion dominates, compression and retention changes may be most effective. If processing dominates, rightsizing or code efficiency reviews may yield better results.
| Stage | Component | Primary cost driver | Allocated cost (GBP/month) |
|---|---|---|---|
| Ingestion | Kafka topic: transactions.raw | Broker storage and cross-zone replication | 7,000 |
| Processing | Flink job: rules_and_ml_scoring | CPU and memory for stateful processing | 6,000 |
| Serving | Low latency store for recent decisions | High availability storage and queries | 4,000 |
| Analytics | ClickHouse table: fraud_events_daily | Columnar storage and analytical queries | 3,000 |
| Replication | Cross-region mirror for critical topics | Network egress and remote storage | 2,000 |
Table 8: Example cost map for a fraud detection streaming pipeline.
You can connect this cost view with business metrics such as fraud losses prevented, false positive rate, and authorization latency. A simple way to do this is to calculate cost per thousand decisions and compare it against estimated loss reduction per thousand transactions. This ties streaming cost directly to business outcomes and helps prioritize optimization work.
Example: Topic retention review playbook
A final practical example is a topic retention review playbook. Many organizations discover that a significant portion of their Kafka storage cost comes from topics with default or overly conservative retention periods. A quarterly retention review can be a lightweight but high-impact FinOps activity.
A simple retention review playbook might include the following steps:
- Export a list of all topics, including current retention settings, size on disk, and owning team for each one.
- Sort the list by total retained bytes, focusing first on the largest topics and those with the longest retention configurations.
- Review each topic with its owning team to confirm how far back data actually needs to remain online for their operational use cases.
- Adjust retention settings where the current configuration is significantly higher than the demonstrated need.
- Track total retained bytes and storage cost before and after the review, so realized savings can be quantified and reported.
Tools and Observability Stack
FinOps for streaming depends on a strong observability and cost tooling stack. You need reliable metrics on throughput, lag, and storage, combined with timely cost data that can be sliced by cluster, namespace, topic, and team. Open-source projects such as Prometheus, Grafana, OpenCost, and Kubecost, combined with cloud billing exports, are common building blocks.
Typical components of a streaming FinOps stack include Prometheus for metrics collection, Grafana for dashboards, OpenCost or Kubecost for Kubernetes cost allocation, and your cloud provider billing export for detailed invoices.
Metrics and labeling strategy
The foundation of cost observability is a consistent metrics and labeling strategy. Every workload that uses the streaming platform should carry metadata that identifies its owning team, environment, and cost center. In Kubernetes, this typically means standard labels on namespaces, Deployments, and StatefulSets. These labels are then ingested by cost tools so that spend can be allocated correctly.
Examples of useful labels for a stream processing job in Kubernetes include:
- Team: which engineering team owns the workload
- Environment: such as production, staging, or development
- Cost-center: the financial owner or budget code
- Data-classification: such as critical, confidential, or public
- Service: a logical service or capability name, used in reporting
Code example 3: Kubernetes labels for cost allocation (YAML)
apiVersion: apps/v1
kind: Deployment
metadata:
  name: fraud-scoring-job
  labels:
    app: fraud-scoring
    team: payments
    environment: production
    cost-center: cc-1423
    data-classification: critical
spec:
  replicas: 3
  template:
    metadata:
      labels:
        app: fraud-scoring
        team: payments
    spec:
      containers:
      - name: fraud-scoring
        image: my-registry/fraud-scoring:latest
        resources:
          requests:
            cpu: "2"
            memory: "4Gi"
Once these labels are in place, tools such as OpenCost and Kubecost can attribute node, storage, and network costs back to the appropriate teams and environments. This enables showback for all streaming workloads and sets the stage for more formal chargeback where it makes sense.
Cost and usage dashboards
Dashboards are the primary interface that engineers and leaders use to understand streaming costs. The most effective designs are organized around the Domains they serve and the Personas who consume them, so that each view answers a specific question rather than trying to be everything to everyone.
Useful dashboard views include:
- Understand Usage & Cost view (Leadership and Finance Personas): organization-wide views of total streaming spend, broken down by business unit, team, and environment. This view operationalizes the Reporting & Analytics Capability.
- Quantify Business Value view (Product and Engineering Personas): cluster-level views showing utilization, unit cost per million messages, cost per GB retained, and top cost drivers by topic and job. This view operationalizes the Unit Economics and KPIs & Benchmarking Capabilities.
- Optimize Usage & Cost view (Engineering Personas): real-time views that combine cost, throughput, consumer lag, and storage growth for key pipelines, with filters by team and environment. This view supports the Usage Optimization and Anomaly Management Capabilities by surfacing inefficiencies and unexpected changes as they happen.
In practice, these views often live in Grafana or a similar dashboarding tool. A topic-level dashboard, for example, might show throughput, partition count, storage size, consumer lag, and allocated monthly cost side by side. This reinforces the idea that cost is simply another dimension of system health, alongside latency and error rates, and changes cost from a quarterly conversation into a daily one.
Alerting on cost and usage anomalies
Alerting connects observability to action. Instead of discovering cost issues only in monthly reports, you can trigger alerts when usage or spend deviates from expected patterns. A common pattern is to calculate expected daily spend per cluster and set thresholds for percentage deviation over a rolling window.
Prometheus and Alertmanager are frequently used for this purpose. Cost metrics from OpenCost are scraped into Prometheus, and alerting rules notify FinOps and platform teams when anomalies occur.
The following example illustrates a conceptual PromQL query and an associated alert rule.
Code example 4: Prometheus query and Alertmanager rule for cost anomalies
# PromQL expression (conceptual)
cluster_daily_cost = sum_over_time(opencost_cluster_cost[1d])
expected_cost = predict_linear(cluster_daily_cost[14d], 0)
anomaly = (cluster_daily_cost - expected_cost) / expected_cost

# Alert rule snippet
groups:
- name: finops-alerts
  rules:
  - alert: StreamingCostAnomaly
    expr: anomaly > 0.3
    for: 2h
    labels:
      severity: warning
    annotations:
      summary: "Streaming cluster cost anomaly detected"
      description: "Daily cost is more than 30 percent above expected trend for cluster {{ $labels.cluster }}."
Best Practices and Recommendations
With tooling and examples in mind, this section summarizes practical best practices for running an efficient real-time data platform under a FinOps model. These practices are drawn from common guidance in the FinOps community and from teams operating large, multi-tenant streaming platforms.
Align with FinOps Principles
The FinOps Framework describes a set of Principles that underpin successful practices, including collaborating across teams, making business value a key driver of decisions, and ensuring that everyone takes ownership of their technology usage. Applying these principles to streaming means turning high-level ideas into concrete behaviors.
Examples include:
- Shared ownership: Practitioners, Engineering, Product, and Finance Personas jointly own streaming costs and reliability, and meet regularly to review trends.
- Business value first: cost discussions are framed around the value of specific real-time capabilities, not just savings targets.
- Timely access to data: engineers have self-service access to cost and usage data alongside operational metrics, so they can make tradeoffs quickly.
- Central enablement: a small FinOps group provides the framework, tooling, and coaching rather than acting as a gatekeeper for every change.
Governance through policies and guardrails
Governance for streaming should focus on clear policies and automated guardrails rather than manual approvals for every change. The aim is to prevent accidental or uncontrolled cost growth while still enabling teams to move quickly.
- Topic lifecycle policies that define how topics are created, reviewed, and decommissioned, including required metadata such as owner and purpose.
- Namespace and team quotas for CPU, memory, and retained bytes in production clusters, with soft limits that trigger alerts and hard limits that block unsafe changes.
- Checks that block very long retention in non-production environments unless explicitly approved, often implemented through policy as code.
- Approval workflows for cross-region replication or particularly expensive workloads, based on clear criteria rather than ad hoc decisions.
Implementation roadmap
Teams new to FinOps for streaming rarely adopt every practice at once. A staged roadmap helps maintain momentum and avoids overwhelming platform and product teams. Table 9 illustrates a simple Crawl, Walk, Run progression.
| FinOps maturity | Focus | Key activities | Typical timeframe |
|---|---|---|---|
| Crawl | Visibility and basic allocation | Enable cost exports, define labels, implement a simple topic-based allocation model, and build initial dashboards. | 1 to 3 months |
| Walk | Optimization and governance | Introduce storage and network optimization, implement topic lifecycle and quotas, and set up cost anomaly alerts. | 3 to 9 months |
| Run | Continuous optimization and automation | Automate cleanups, integrate costs into deployment workflows, and extend showback or chargeback models. | Ongoing |
Table 9: Example implementation roadmap for FinOps on streaming platforms.
The precise timings will vary by organization, but the general pattern holds. Start by making costs visible in the language that engineering teams use. Then target obvious inefficiencies with structured projects. Finally, embed FinOps into day-to-day workflows so that optimization becomes routine rather than exceptional.
Maturity assessment
A simple maturity model helps you assess where your organization is today and what to prioritize next. Table 10 provides an example tailored to streaming platforms. You can use it as a self-assessment tool in workshops or quarterly reviews.
You do not need to reach the highest maturity level everywhere. Many organizations choose to apply more rigorous controls to production and cross-region workloads while keeping lighter-weight processes for experimentation and development clusters.
| Dimension | Crawl | Walk | Run |
|---|---|---|---|
| Visibility | High-level cluster cost only | Cost by team and major pipeline | Real-time cost per topic and feature |
| Optimization | Ad hoc cleanups | Structured optimization projects every quarter | Continuous optimization embedded into delivery |
| Governance | Manual approvals, limited policies | Standard policies with partial automation | Policy as code with automated guardrails |
Table 10: Streaming FinOps maturity matrix (example).
Advanced Techniques
Once you have the basics in place, you can explore more advanced techniques that deepen cost efficiency and resilience for streaming platforms. These approaches often rely on custom metrics, predictive models, and policy as code.
Custom metrics based autoscaling for streaming jobs
Autoscaling based purely on CPU or memory utilization is rarely ideal for streaming workloads. Instead, you can use custom metrics such as consumer lag, backlog size, or messages processed per second to scale processor replicas up and down. Kubernetes Horizontal Pod Autoscaler supports this pattern through external or custom metrics adapters.
The Horizontal Pod Autoscaler can be combined with a metrics adapter that exposes Kafka lag metrics from Prometheus into the Kubernetes custom metrics API.
Code example 5: Conceptual HPA for a lag-based consumer
apiVersion: autoscaling/v2
kind: HorizontalPodAutoscaler
metadata:
  name: fraud-consumer-hpa
spec:
  scaleTargetRef:
    apiVersion: apps/v1
    kind: Deployment
    name: fraud-consumer
  minReplicas: 2
  maxReplicas: 20
  metrics:
  - type: External
    external:
      metric:
        name: kafka_consumer_lag_seconds
        selector:
          matchLabels:
            consumer_group: fraud-consumer
      target:
        type: AverageValue
        averageValue: "30"  # target max lag in seconds
In a full implementation, you would export consumer lag into Prometheus, configure a metrics adapter, and then fine-tune the autoscaling policy to avoid thrashing. The payoff is better alignment between resource usage and actual backlog, which reduces cost while preserving latency objectives. It can also reduce the need to size clusters manually for worst-case peaks.
Useful signals for streaming autoscaling include:
- Consumer lag in seconds or messages, segmented by consumer group.
- Backlog size in bytes for critical topics.
- Messages processed per second per replica, indicating headroom.
- Checkpoint times and failure rates for stateful jobs.
Advanced retention and storage tiering strategies
Beyond simple retention tuning, advanced teams use tiered storage and selective compaction strategies to reduce cost without losing important history. For example, recent segments remain on fast local SSDs for performance, while older segments migrate to object storage such as Amazon S3 or Azure Blob. Analytical systems may use separate cold storage layers for historical data accessed only occasionally.
A simple tiering strategy might look like:
- Hot tier: 24 to 72 hours of data on local SSDs for low-latency consumption and replay.
- Warm tier: 7 to 30 days of data in a cheaper but still relatively fast medium, such as larger HDD-backed volumes.
- Cold tier: 30 days to several years of data in object storage or archival systems, queried only through batch analytics.
The right balance depends on your regulatory environment, user expectations, and analytics needs. The key FinOps point is that you do not have to treat all history equally. Moving old data to cheaper tiers can free up significant budget while still meeting compliance and reporting requirements.
Policy as code for cost governance
Policy as code brings consistency and automation to cost governance. Tools such as Open Policy Agent and Kubernetes admission controllers can enforce rules at deployment time. For example, you can require cost center labels, restrict retention for non-production environments, or block topics without an owning team.
In practice, you would store policies in version control, review them like application code, and roll them out through your standard deployment pipelines. This makes governance auditable and reduces the manual overhead on platform and FinOps teams. It also creates a clear mechanism for exceptions, since teams can propose policy changes through the usual change management process.
The Open Policy Agent (OPA) project provides a policy engine that you can integrate with Kubernetes and other systems to evaluate such rules.
Code example 6: Conceptual OPA policy for cost labeling
package finops.cost_labels

deny[reason] {
    input.kind.kind == "Deployment"
    not input.metadata.labels["cost-center"]
    reason := "Deployment is missing required cost-center label"
}

deny[reason] {
    input.metadata.labels["environment"] == "dev"
    input.spec.template.metadata.annotations["kafka-topic-retention"] > "72h"
    reason := "Dev environments may not request retention longer than 72 hours"
}
Future Trends in Streaming and FinOps
Streaming and FinOps are both evolving quickly. Several trends are likely to influence how organizations manage costs for real-time platforms over the next few years. You do not need to adopt all of them immediately, but being aware of them helps with long-term planning.
| Trend | Description | FinOps implications |
|---|---|---|
| Serverless and fully managed streaming | Cloud providers expand managed Kafka and Flink services with autoscaling and integrated billing. | Shifts focus from infrastructure tuning to unit cost benchmarking, usage controls, and vendor comparison. |
| Deeper integration between observability and cost data | Vendors and open-source projects expose cost metrics alongside operational telemetry. | Enables more automated decision making and tighter feedback loops for optimization. |
| ML-driven anomaly detection and forecasting | Machine learning models predict spend and flag unusual patterns proactively. | Improves budgeting accuracy and reduces the time to detect misconfigurations or runaway workloads. |
| Sustainability-focused metrics | Carbon footprint and energy usage metrics become first class alongside cost. | Supports tradeoffs between performance, cost, and environmental impact, and may influence selection and workload placement. |
Table 11: Selected future trends and their FinOps impact.
Conclusion
Real-time data platforms unlock powerful capabilities, from low-latency personalization to real-time risk management. They also introduce a distinctive cost profile: always-on infrastructure, heavy replication, significant storage and network usage, and substantial operational overhead. The FinOps Framework provides an operating model for bringing financial discipline to these platforms without slowing innovation.
The four FinOps Domains offer a complete way to organize the work. Understand Usage & Cost turns a single cluster invoice into allocated cost by topic, consumer group, and team, making shared infrastructure intelligible to the Personas who use it. Quantify Business Value pairs that allocated cost with unit economics, forecasting, and KPIs so the conversation can move from “what does streaming cost” to “is the value-to-cost ratio improving.” Optimize Usage & Cost brings the technical levers such as rightsizing under resilience constraints, retention and tiering policies, network-aware placement, compression, and commitment-based rate optimization across both self-managed and SaaS streaming offerings. Manage the FinOps Practice keeps the work continuous through governance, automation, education, and the executive-level architecture decisions that shape what the platform costs in the first place.
The FinOps Capabilities that matter most for streaming will be familiar to anyone working with the Framework: Allocation, Reporting & Analytics, and Anomaly Management in the first Domain; Unit Economics, Forecasting, Budgeting, and KPIs & Benchmarking in the second; Usage Optimization, Architecting & Workload Placement, Rate Optimization, Sustainability, and Licensing & SaaS in the third; Governance, Policy & Risk, Automation, Tools & Services, FinOps Education & Enablement, and Executive Strategy Alignment in the fourth. What is distinctive about streaming is not the Capabilities themselves but the intensity with which the always-on, stateful, replication-heavy nature of these platforms exercises each one.
Streaming usually costs more than batch in absolute terms. It almost always should because that is what unlocks the capabilities the business is paying for. The FinOps question is not whether streaming is cheap. It is whether the incremental value justifies the spend, and whether the practice is disciplined enough to keep that value-to-cost ratio improving over time. The FinOps Framework, applied with care to the specifics of real-time infrastructure, is how teams answer both.
Acknowledgments
We would like to thank the following people for their work on this paper:



Last updated: August 26, 2026
