How to Calculate Effective Savings Rate (ESR)
Summary: The Effective Savings Rate (ESR) is a KPI used by FinOps practitioners to measure the true financial performance of cloud discount instruments, such as Reserved Instances (RIs) and Savings Plans (SPs). To calculate ESR, teams must compare the actual savings generated against the On-Demand Equivalent (ODE) Spend—the cost that would have been incurred without any discounts.
The Effective Savings Rate (ESR) is the Return on Investment (ROI) for cloud discount instruments and the one output metric you can measure true savings performance. This playbook describes the steps to calculating this metric in AWS. Similar, adapted instructions could be applied for calculating ESR for other Cloud Service Providers (CSPs).
Who Should Use this Playbook
ESR should be used by anyone managing commitment discounts to rate optimize on cloud usage costs.
Prerequisites
To calculate and utilize an Effective Savings Rate (ESR), access to billing and usage data is a primary requirement. This can include CSP-native tools e.g. AWS Billing and Cost Management, third-party cloud cost management tooling, or custom-built reporting solution offering the required foundational metrics that include commitment discount information such as coverage, utilization, and discount achieved compared to the list, on-demand unit cost. Data sources vary by cloud service provider. Access to detailed billing information including raw data files, billing dashboards, or command line access to cloud billing data is required.
Who needs to be involved
- An Engineering, FinOps, or Finance team member will perform calculations comparing public rates against actual rates paid for cloud services.
- An Engineering, FinOps, or Finance team member will publish the metric for visibility and reporting to be used as a benchmark of commitment discount management effectiveness
Information and resources required
In order to calculate the Effective Savings Rate, data from the cloud service provider will be required, as well as accessible
- Ensure you have the required data set based on your cloud service provider
- Ensure you have access to the billing data (IAM Permissions)
- Ensure you have a method of querying the data to calculate the Effective Savings Rate
Information
- Cloud Cost and Usage Data is required to calculate the effective savings rate. The data must represent the on-demand equivalent (ODE) of the discounted usage, or the price of the usage if it had not received a discount, which is not available from some common reporting tools, such as AWS Cost Explorer Console.
- To be successful in computing this metric you must know how to use tools such as the Cost Explorer CLI to access this information.
Tools, Utilities & Templates
Links to tools, utilities, and templates to use during the playbook.
AWS Cost Explorer CLI: You can use the Cost Explorer API to programmatically query your cost and usage data. This offers ‘On Demand Cost Equivalent’ Spend (Pre-Discount) compared to Cost Explorer Dashboard which, at the time of publication, is not available from Cost Explorer.
Instructions for running this Play
This play can be run by any Persona with the proper resource access but is typically run by a FinOps Practitioner or an Engineering member.
Prep – 5 minutes
- Log into your tool of choice and ensure you have access to all required data
- Command Line Tool integrated with AWS CLI (Instructions)
- AWS CLI Profile -or- AWS Console with proper permissions to access commitments utilization and coverage
- Customize the CLI commands provided below to return data points to be used in the ESR calculation. Customized parameters may include:
- Time Window for Effective Savings Rate (Recommend a full month)
- Service(s) for which you would like to calculate ESR
- This play walks through AWS Compute services only, and others may require a separate command line prompt (AWS CLI Documentation)
Example – 10 minutes
Data Collection – Option 1
Run the following AWS CLI commands to extract the required values used in the AWS Compute-specific ESR calculator below:
(Note: End Date is Non-Inclusive.Consider altering the date periods (highlighted) to fit your specific needs)
AWS CLI Command: get-savings-plan-utilization → Returned Values: OnDemandCostOfSPHoursUsed (Step A) & NetSPSavings (Step E):
aws ce get-savings-plans-utilization --time-period Start=2024-05-01,End=2024-06-01 --filter '{ "Dimensions": { "Key": "SAVINGS_PLANS_TYPE", "Values": [ "ComputeSavingsPlans", "EC2InstanceSavingsPlans" ] } }' --query 'Total.Savings.[{OnDemandCostOfSPHoursUsed: OnDemandCostEquivalent}, {NetSPSavings: NetSavings}]'
AWS CLI Command: get-reservation-utilization → Returned Values:OnDemandCostOfRIHoursUsed (Step B) & NetRISavings (Step F):
aws ce get-reservation-utilization --time-period Start=2024-05-01,End=2024-06-01 --filter '{ "Dimensions": { "Key": "SERVICE", "Values": [ "Amazon Elastic Compute Cloud - Compute" ] } }' --query 'Total.[{OnDemandCostOfRIHoursUsed: OnDemandCostOfRIHoursUsed}, {NetRISavings: NetRISavings}]'
AWS CLI Command: get-savings-plan-coverage → Returned Value: OnDemandCost (Step C)
aws ce get-savings-plans-coverage --time-period Start=2024-05-01,End=2024-06-01 --filter '{ "Dimensions": { "Key": "SERVICE", "Values": [ "Amazon Elastic Compute Cloud - Compute", "Amazon EC2 Container Service", "Amazon Elastic Container Service", "Amazon Elastic Container Service for Kubernetes", "AWS Lambda" ] } }' --query 'SavingsPlansCoverages[].Coverage.{OnDemandCost: OnDemandCost}'
Data Collection – Option 2
Alternatively, using the AWS Console, you can readily get the required values for the ESR calculation from 3 standard reports:
Reservations Utilization Report (Step B and Step F):
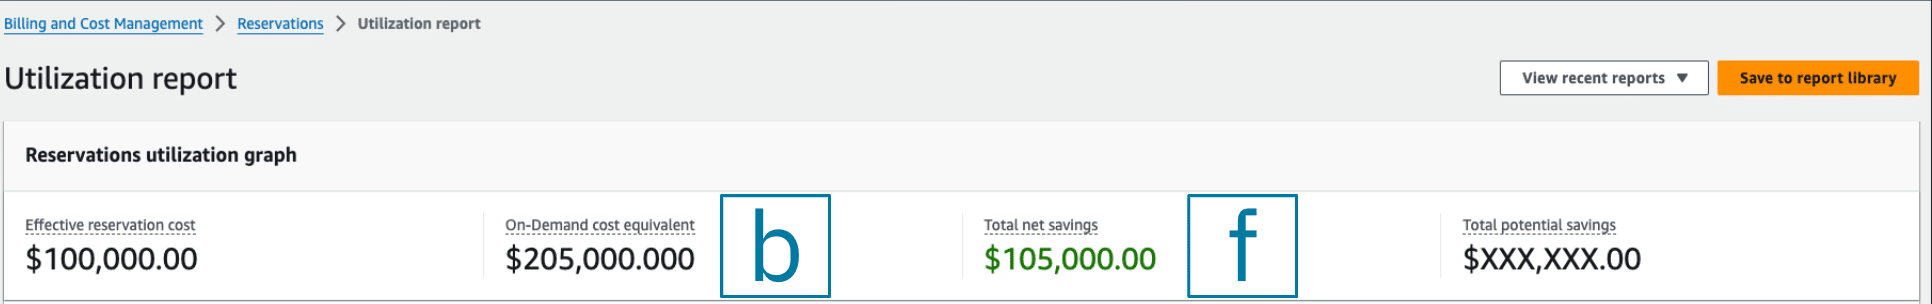
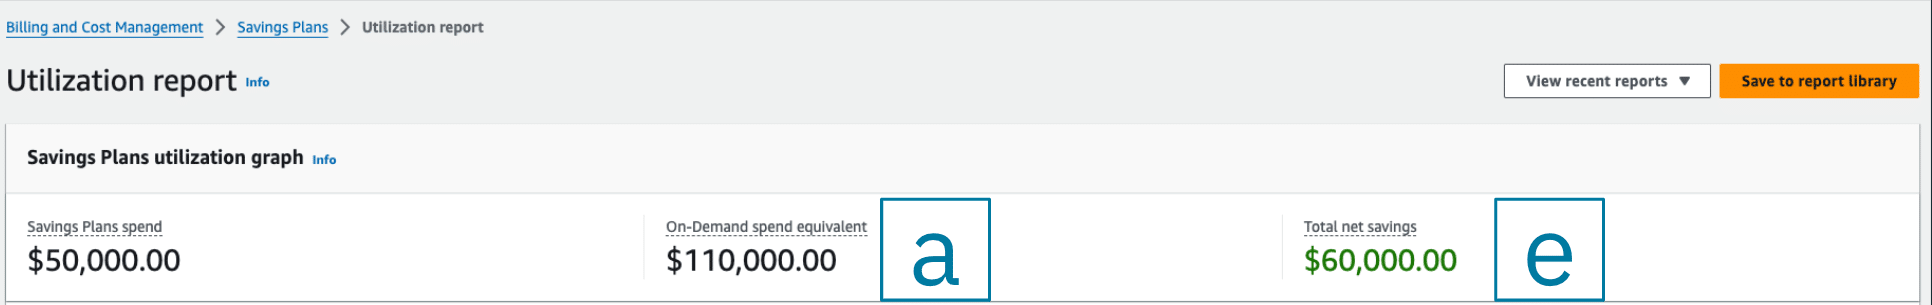
Savings Plans Utilization Report (Step A and Step E):
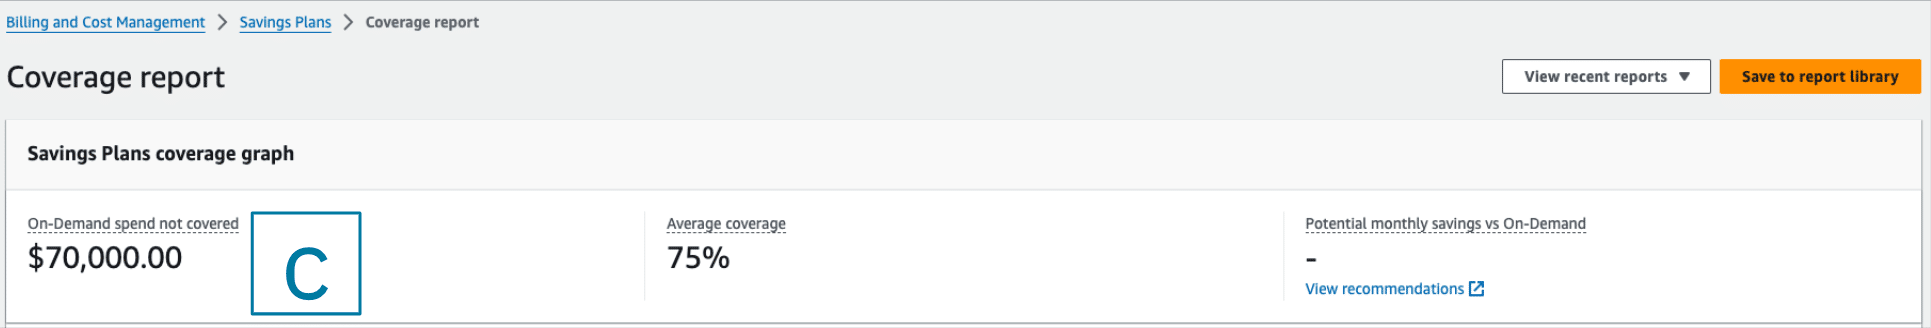
Savings Plans Coverage Report (Step C)
ESR Calculator Worksheet
Enter the data shows using the values returned from the CLI calculations, you will calculate the ESR as follows:
| PART 1 | Enter Data: |
| A. Savings Plan On-Demand Equivalent Spend (EC2, Fargate, Lambda) | |
| B. Reserved Instance On-Demand Equivalent Spend (EC2) | |
| C. On-Demand Spend (EC2, Fargate, Lambda) | |
| PART 2 | |
| D. Compute On-Demand Equivalent Spend (A + B + C from above) | |
| E. Savings from Compute-related Savings Plans | |
| F. Savings from compute-related Reserved Instances | |
| PART 3 | |
| G. Compute RI & SP Savings (E + F from above) | |
| Enter the costs to achieve savings outcome, if any | |
| H. Cost to Achieve Savings (CMP, service, time, tooling, etc. cost) |
Calculate Your Effective Savings Rate
    Effective Savings Rate (G - H) / D

    (RI & SP Savings minus Costs to Achieve Savings Outcome) / On-Demand Equivalent Spend
Other Calculations:
Effective Savings Rate = Cloud Savings Generated / On Demand Equivalent (ODE) Spend
Example: $5,000 in SP Savings / $10,000 in ODE Spend = 50% Effective Savings Rate
Effective Savings Rate = Reserved Instance (RI)/Savings Plan (SP) Utilization x RI/SP Coverage x RI/SP Discount
Example: 90% SP Utilization x 100% Coverage x 50% Discount = 45% Effective Savings Rate
Outcomes and Indicators of Success
Primary Outcomes of running this playbook
- Know your ESR
- Be able to take action to improve your ESR (see below for some suggested actions based on your situation)
- Generate incremental cost savings consistently
Indicators of Success
A metric isn’t useful unless one can use it to understand how they compare against peers and take action to improve it. Industry research is being conducted to help FinOps teams understand what a good ESR looks like for different types of organizations and across various levels of cloud spend.
Insights from ESR Benchmarking:
Based on a benchmarking analysis performed by ProsperOps, using thousands of anonymized AWS organizations’ data from AWS Cost and Usage Reports, the research found that rate optimization outcomes for AWS compute, including Ec2, Lambda, and Fargate, were generally poor and that there is significant room for improvement.
Median ESR (0%), which meant that organizations paid the on-demand rate rather than leverage discount instruments, such as AWS Savings Plans/ Reserved Instances. Even at the 75th percentile, the ESR was only at 23%, which means orgs generated a 23% discount off the on-demand rate. World-class ESR at the 98th percentile was at 46% though.
Low ESR outcomes may be due to several factors: organizations may be prioritizing engineering optimization before rate optimization, organizations may have a suboptimal rate optimization strategy but not know they can do better, and engineering choices can affect ESR (see Considerations section). Indeed, AWS Savings Plans were the most popular (38% of AWS orgs used them), whereas only 18% used Standard Reserved Instances and 14% used Convertible Reserved Instances.
Best Practices for Benchmarking:
When it comes to best practices for benchmarking ESR data, it is worthwhile to take a look at peers based on industry and usage. ESR and usage appear to be correlated. There might be a number of reasons , including the fact that companies with lower usage may have less resources and expertise in cloud cost optimization. They might also be younger companies with uncertain futures that would choose 1-year commitment terms rather than 3-year terms, which gives them a lower discount.
Taking Action based on ESR Segments:
Below we describe the segments for (1) Negative ESR, (2) Below Average ESR, (3) Low Usage but Above Average ESR, and (4) High Usage with Above Average ESR and provide some suggested actions:
- Negative ESR – You pay a premium over the on-demand rate for compute, likely due to overcommitment and/or underutilized commitments. Your usage and commitments are mismatched. Consider unwinding commitments, such as letting them expire or adjusting them to match your usage.
- Below Average ESR – If you have a low ESR, below the 75th percentile, you have significant economic upside to improve your ESR and rate optimization. Automation can help you adapt to changes in the future, whether planned or unplanned, and reduce manual commitment management.
- Low Usage, Above Average ESR – Your ESR is measured at a point in time and can fluctuate daily. To consistently achieve high ESR, you need to ask yourself if your current ESR is sustainable, and how your usage will change in the future. If you are only decreasing usage, then your ESR increase is likely temporary. Going forward, as your organization increases usage — especially in volatile environments — you may need to consider a portfolio of different types of discount instruments that give you the most flexibility while keeping your ESR consistently high.
- High Usage, Above Average ESR – If your ESR is consistently high and you don’t anticipate any usage changes in the future, then you are doing great. However, maintaining stable and consistently high commitment coverage and utilization is extremely difficult — we rarely see this usage pattern and consistently high ESR.
Questions you may want to ask yourself include:
- How much incremental value can you get from maximizing your ESR?
- For example, what is the value of increasing ESR from the 80th to 98th percentile? (increasing from 40% to 46% ESR)
- Is your cost optimization strategy sustainable?
- Do you anticipate declines in your usage from future engineering optimizations? A strategy that relies on spend-based discount instruments, such as AWS Savings Plans, would put you at risk of overcommitment. Would it be better to deploy more flexible discount instruments?
- Can you offload manual commitment management to automated technologies, so you can focus on other priorities?
- If you are operating at scale, you may be considering or have an enterprise agreement with your cloud provider. A more flexible rate optimization strategy with automation allows you to systematically align commitment expiration dates with your enterprise agreement terms. This way, you have more leverage during contract negotiations or during renewal discussions with your cloud provider.
Exceptions and Considerations
ESR may depend on engineering choices. It is important to note that there are engineering choices teams can make that will positively or negatively impact your ESR. For example, AWS provides discounted pricing based on different criteria, including region, instance family, operating system (e.g. Linux, Microsoft), workload volatility, and type of discount instrument used. Google Cloud Platform’s Committed Use Discounts (CUDs) for Compute Engine are also based on machine series (e.g. General Purpose machines – C3, N2). All of these factors can affect your ESR, either favorably or unfavorably.
To illustrate this point, all other things being equal, an AWS instance running a Linux operating system will cost less than an instance running a Microsoft operating system. Likewise. running an instance in the Oregon region will cost less than running the same instance type in Sydney.
Related Resources
- Commitment Discounts: Effective Savings Rate is a measure of the ROI and efficiency of Commitment Discount strategies
Related FinOps Resources and Framework Capabilities
- Commitment Discount
- Commitment Utilization – The percentage of active commitments utilized during the specified period.
- Coverage – The percentage of eligible workloads that were covered by active commitments during the specified period.
Acknowledgments
We’d like to thank the following people for their work on this Playbook:


We’d also like to thank our supporters, Brian D’Altilio and Jag Sodhi.