
This content was provided as a Professional Contribution through the FinOps Certified Professional program.
Utilizing Azure Invoice Data to Understand Usage and Cost
Summary: Tracking raw public cloud costs requires transforming complex billing data into a visual, readable format that engineering and business teams can easily act upon. Connect Azure invoice data directly to Power BI to create self-service dashboards that map costs to specific subscriptions, resource groups, and tags. This foundational visibility is critical for establishing effective showback and chargeback models.
One of the most important steps in tracking public cloud costs is to have reliable and timely data. Since cloud data is not easily readable by humans, it must be connected to a data visualization tool. While there are numerous third-party vendors offering products for purchase, Microsoft provides the necessary cost data for self-service. Organizations operating in Azure can access this data and connect it to Power BI at a very low cost.
The public cloud functions similarly to a utility company. Each database, virtual machine, storage container, or network incurs hourly and daily costs. Azure invoice data can be downloaded at the daily or monthly level from the Azure portal. Established cost reports in Power BI can be refreshed at the click of a button and give insight into where to focus efforts to optimize costs.
Failing to monitor costs or take action on runaway costs leads to overspending. Thus, it is very important to review spending and look for ways to save money in your cloud operations. Power BI provides a useful tool for easily spotting trends, producing chargeback reports, and doing other data related tasks.
Prerequisites
Cost Reader access at the management group level. Azure has built in user roles that allow team members to access cost data. Permissions are granted by Azure role administrators for each organization.
Power BI Desktop – The users need the desktop version to create a data model that utilizes Azure invoice data.
Data Analyst skills in Power BI – Users need basic skills in Power BI to create reports and need to understand the basics of an Azure invoice. This skill takes time to build.
Azure Invoice Basics
For enterprise agreement customers there are two invoice files for tracking how much was spent. One data set is your monthly azure invoice. That data can be used to create showback or chargeback reports. The other data set is called amortized cost data. That includes the monthly cost of reservations that are prepaid for 12 or 36 months. Otherwise, the two data sets are almost identical.
In this paper, the monthly invoice data will be called actual costs data and amortized data will be referred to as amortized costs. Users can connect either data set to Power BI or create reports that help them to understand their cloud costs. Using this tool, cost increases can be investigated and reported back to technical staff. The link below provides instructions on how to connect in Power BI.
Learn more about connecting Microsoft Cost Management data in Power BI Desktop.
In the context of the Understand Usage and Cost Domain…
(Capability) Data Ingestion
Microsoft makes invoice data available to be ingested into Power BI. The invoice data is aggregated daily with new data available in real time. The most basic function of ingesting data can be done with the click of a button. Power BI ingests the data into a data model that can be used for cost reporting.
(Capability) Allocation
Microsoft data is structured to allow for showback and chargeback of costs. It is necessary to understand how the data is structured and how it can be reported back.
Azure cost data is organized within this hierarchy:

- Azure Account – This is the primary identifier for a monthly invoice. An invoice file will show data for one EA account.
- Subscription – Each team or business unit can have a dev, prod and test subscription that allows for showback and tracking of costs. Typically, each team (or unit) would have three subscriptions. Having separate subscriptions for each business unit makes it easier to do accurate chrageback by subscription.
- Resource Group – a logical container of Azure resources that are typically connected to an application or tasks. All the resources for one job could be placed into a single resource group. For example, a resource group might host virtual machines with networking resources and storage containers.
- Resource Name – a unique name of a resource for example: a database, virtual machine, storage container. Each resource is billed according to the type of product.
- Resource Types – There are different types of resources, and each has a unique cost that is billed hourly, monthly, or according to the volume of data.
The other key aspect is billing for different products or services that are offered by Microsoft. Here is the hierarchy that describes products.
Understanding the Meter Category
The meter category is a group of resource types. It is organized into the following hierarchy:
Meter Category
      Meter Sub-Category
            Meter Name
Each meter is a unique product that can have a different billing rate. The meter category is useful for summarizing the monthly cost by resource type and understanding how money is being spent.
Understanding the Implications of Tagging
Organizations that want more granularity can set up tags for the resource groups or the resource. The tagging is a way to have increased granularity for showback and chargeback. For example, we can see the costs of an application by using an app name tag and creating a cost report for all resources that have that tag.
Once the data is Power BI, those tags can be turned into columns. That allows the organization to report on costs by tag, which is very useful for doing showback or chargeback of costs. The link below has instructions on how to create a unique column in Power BI for each tag. This converts the tags from JSON format to columns.
How do you use Power BI to identify cost increases?
Users want to put relevant cost data into the path of key personas.
Power BI reports can be shared across an organization with a wide variety of options for charts and tables. This is a key part if the FinOps process to understand monthly spending and is called a showback of costs. In, addition Power BI can be used to create a chargeback of costs.
Organizations that don’t track their costs will spend thousands more than necessary. The cost data informs us where to target our efforts to optimize costs. First, identify which costs are increasing, then determine if there is a way to optimize or reduce those costs. In this example, we will see how Power BI was used to investigate a cost trend for a service called Log Analytics.
The user will need to spend some time looking at the data to understand how to create basic reports. This link has information about each column in the data model. Data is aggregated at the daily level for each service or product creates one line of data or a daily cost for that service. The user needs to understand the data to be able to visualize it in Power BI.
Optimizing Spending in Log Analytics
Security logging is an essential task for most public cloud users. The three main products for logging in Azure are: Azure Monitor, Sentinel, and Log Analytics. The latter allows the user to customize their logging scripts and save data in tables that can be accessed by KQL queries. There is a cost for ingesting data into Log Analytics and a cost for data storage. The table below shows an example of large variation in monthly costs for Log Analytics.
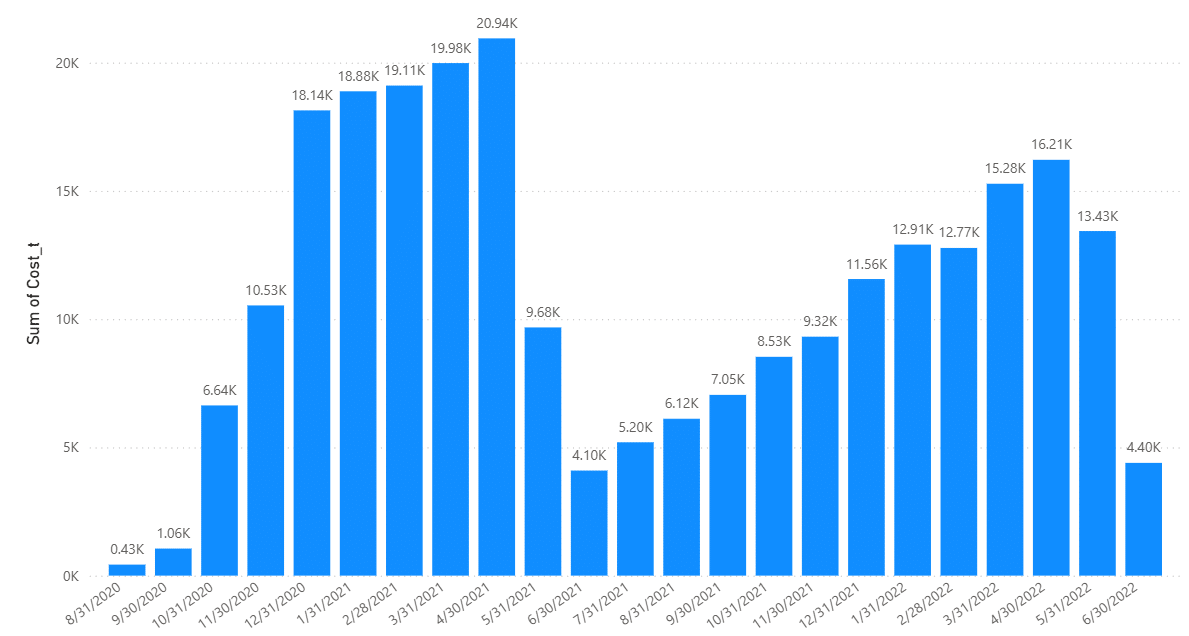
The increasing costs indicates an increase in usage, but it is necessary to investigate why costs are increasing. There is a reason that costs were trending so high, and the dip in costs is the result of deliberate action to reduce costs.
Meter Category: Log Analytics
      Meter Sub-Category: Null
            Meter Name:
                  log analytics data ingestion
                  log analytics data storage
A data table shows the meter category and meters for each distinct product. Each meter name represents a distinct rate for costs. It could be charged hourly, or by quantity of data.
In this case, the data shows that the cost for data retention is increasing while data ingestion is not. There would be an increasing quantity of gigabytes of data that is driving the cost increase.
The cost for storing data in a log analytics workspace is .10 per gigabyte per month, after the first 90 days. The only way to reduce the expense is to have less data volume. It would be cheaper to move that data to blob storage which costs .018 per gigabyte. In the chart above, costs dropped after data was moved out of the workspace and he quantity of data decreased.
In the data below, there is a clear trend of increasing costs. Those costs will probably continue to increase if no action is taken.

Using Power BI to view Azure costs data is a good option for organizations that want to operate using the FinOps Framework. One of the most important domains is Understand Usage and Cost.
Having access to the data allows users to perform tasks in all domains of the FinOps Framework. It takes time to build skills and familiarity with the data. However, once the reports are established, they can be refreshed from month to month and shared with key personas that can act when necessary.
Doing the reports in Power BI is only a Crawl maturity level. However, it is an essential step in the process of setting up automation or to advance to the next level of maturity. In addition, sharing these reports can help drive all aspects of the FinOps process.
The cost data informs us where to focus efforts to reduce monthly spending. Companies that want to start immediately, without relying on a third-party tool can build reports and start to understand their monthly costs. These reports can also be used for key tasks like showback and chargeback. Organizations that have skilled data analysts on staff will want to take advantage of the cost data that is available from Azure.
